
Nomenclature
Short Name:
BARK2
Full Name:
Beta-adrenergic receptor kinase 2
Alias:
- Adrenergic, beta, receptor kinase 2
- ARBK2
- G-protein coupled receptor kinase 3
- ADRBK2
- Beta-adrenergic receptor kinase 2
- Beta-ARK-2
- EC 2.7.11.15
Classification
Type:
Protein-serine/threonine kinase
Group:
AGC
Family:
GRK
SubFamily:
BARK

Structure
Mol. Mass (Da):
79710
# Amino Acids:
688
# mRNA Isoforms:
1
mRNA Isoforms:
79,710 Da (688 AA; P35626)
4D Structure:
NA
1D Structure:
Subfamily Alignment
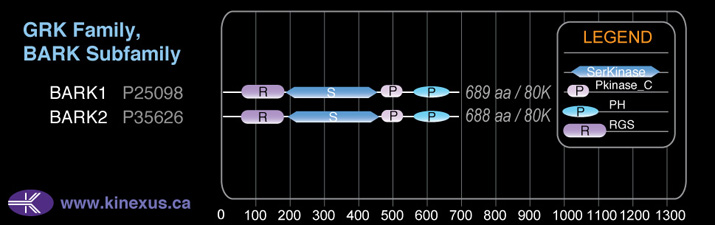
Domain Distribution:
Post-translation Modifications
For detailed information on phosphorylation of this kinase go to PhosphoNET
Serine phosphorylated:
S350+, S423, S514, S670, S685.
Threonine phosphorylated:
T353-, T524, T612, T672.
Tyrosine phosphorylated:
Y109, Y112, Y206, Y356-, Y526, Y564, .
Ubiquitinated:
K344, K345.
Acetylated:
K625, K628.
Distribution
Based on gene microarray analysis from the NCBI
Human Tissue Distribution
% Max Expression:
Mean Expression:
Number of Samples:
Standard Deviation:
% Max Expression:
Mean Expression:
Number of Samples:
Standard Deviation:
 92
92
1074
35
1072
 4
4
42
17
39
 4
4
52
22
49
 24
24
274
142
350
 59
59
684
35
545
 2
2
21
83
13
 19
19
223
45
455
 94
94
1092
62
2294
 25
25
294
17
248
 5
5
61
133
51
 3
3
37
49
40
 47
47
546
208
612
 11
11
131
44
150
 2
2
28
14
31
 7
7
85
43
94
 3
3
35
20
24
 5
5
63
362
92
 4
4
52
30
44
 4
4
45
121
31
 44
44
511
137
539
 6
6
67
43
70
 14
14
161
47
161
 5
5
63
24
62
 17
17
193
33
197
 10
10
116
43
126
 60
60
700
92
1154
 8
8
90
47
100
 4
4
51
31
43
 5
5
64
29
58
 11
11
125
42
91
 20
20
235
24
219
 46
46
534
41
547
 15
15
179
76
443
 100
100
1165
78
846
 41
41
474
48
514
Evolution
Species Conservation
PhosphoNET % Identity:
PhosphoNET % Similarity:
Homologene %
Identity:
PhosphoNET % Identity:
PhosphoNET % Similarity:
Homologene %
Identity:
 100
100
100
100 81.1
81.1
90.1
99 95.3
95.3
96.1
99 -
-
-
95.5 -
-
-
97 91.9
91.9
93.6
96 -
-
-
- 91.3
91.3
96.1
91 91.1
91.1
96.4
91 -
-
-
- 36.3
36.3
39.5
- 84.2
84.2
86.2
93 23.8
23.8
38.7
93 90.5
90.5
95.3
91 -
-
-
- 65.3
65.3
77.6
68 67.5
67.5
79.1
- 64.6
64.6
78.5
68 -
-
-
- -
-
-
- -
-
-
- -
-
-
- -
-
-
- -
-
-
- -
-
-
-
For a wider analysis go to PhosphoNET Evolution in PhosphoNET
Binding Proteins
Examples of known interacting proteins
hiddentext
| No. | Name – UniProt ID |
|---|---|
| 1 | OPRM1 - P35372 |
| 2 | CCR4 - P51679 |
| 3 | CXCR4 - P61073 |
| 4 | CCR5 - P51681 |
| 5 | BDKRB2 - P30411 |
| 6 | GIT1 - Q9Y2X7 |
| 7 | AGTR1 - P30556 |
| 8 | GNB1 - P62873 |
| 9 | GNB2 - P62879 |
| 10 | GNB3 - P16520 |
Regulation
Activation:
NA
Inhibition:
NA
Synthesis:
NA
Degradation:
NA
Known Downstream Substrates
For further details on these substrates click on the Substrate Short Name or UniProt ID. Phosphosite Location is hyperlinked to PhosphoNET
predictions.
Based on in vitro and/or in vivo phosphorylation data
| Substrate Short Name | UniProt ID (Human) | Phosphosite Location | Phosphosite Sequence | Effect of Phosphorylation |
|---|
| C-EBPa | P49715 | T226 | HLQPGHPTPPPTPVP | |
| CCR5 | P51681 | S336 | QEAPERASSVYTRST | |
| CCR5 | P51681 | S337 | EAPERASSVYTRSTG | |
| CCR5 | P51681 | S342 | ASSVYTRSTGEQEIS | |
| CCR5 | P51681 | S349 | STGEQEISVGL____ | |
| Cip1 (p21, CDKN1A) | P38936 | T56 | NFDFVTETPLEGDFA | |
| CREB1 | P16220 | S129 | QKRREILSRRPSYRK | + |
| CRMP2 (DPYSL2) | Q16555 | S518 | KTVTPASSAKTSPAK | |
| CRMP2 (DPYSL2) | Q16555 | T509 | PVCEVSVTPKTVTPA | |
| CRMP2 (DPYSL2) | Q16555 | T514 | SVTPKTVTPASSAKT | |
| CRMP4 | Q6DEN2 | S632 | KGGTPAGSARGSPTR | |
| CRMP4 | Q6DEN2 | T623 | PVFDLTTTPKGGTPA | |
| CRMP4 | Q6DEN2 | T628 | TTTPKGGTPAGSARG | |
| ERa (ESR1) | P03372 | S104 | FPPLNSVSPSPLMLL | + |
| ERa (ESR1) | P03372 | S106 | PLNSVSPSPLMLLHP | + |
| ERa (ESR1) | P03372 | S118 | LHPPPQLSPFLQPHG | + |
| GYS1 | P13807 | S641 | YRYPRPASVPPSPSL | - |
| GYS1 | P13807 | S645 | RPASVPPSPSLSRHS | - |
| GYS2 | P54840 | S641 | FKYPRPSSVPPSPSG | - |
| GYS2 | P54840 | S645 | RPSSVPPSPSGSQAS | - |
| hnRNP D | Q14103 | S83 | DEGHSNSSPRHSEAA | |
| HSF1 | Q00613 | S303 | RVKEEPPSPPQSPRV | |
| KOR-1 | P41145 | Y369 | NTVQDPAYLRDIDGM | |
| MAP2 | P11137 | T1616 | YSSRTPGTPGTPSYP | |
| MAP2 | P11137 | T1619 | RTPGTPGTPSYPRTP | |
| MITF | O75030 | S405 | QARAHGLSLIPSTGL | + |
| NACA | Q13765 | T159 | NIQENTQTPTVQEES | |
| NDRG1 | Q92597 | S342 | TSLDGTRSRSHTSEG | |
| NDRG1 | Q92597 | S352 | HTSEGTRSRSHTSEG | |
| NDRG2 | Q9UN36 | S328 | CMTRLSRSRTASLTS | |
| NFH | P12036 | S503 | GGEEETKSPPAEEAA | |
| NFM (Neurofilament M) | P07197 | S510 | EEVAAKKSPVKATAP | |
| NFM (Neurofilament M) | P07197 | S614 | EKPEKAKSPVPKSPV | |
| NFM (Neurofilament M) | P07197 | S666 | PVEEKGKSPVSKSPV | |
| p53 | P04637 | S33 | LPENNVLSPLPSQAM | + |
| PSEN1 | P49768 | S397 | SVLVGKASATASGDW | |
| Tau iso9 (Tau-F) | P10636-9 | S404 | PVVSGDTSPRHLSNV | |
| TBXA2R | P21731 | S239 | AQQRPRDSEVEMMAQ | |
| TBXA2R iso2 | P21731-2 | S357 | RLPGSSDSRASASRA |
Protein Kinase Specificity
Matrix of observed frequency (%) of amino acids in aligned protein substrate phosphosites
Matrix Type:
Experimentally derived from alignment of 18 known protein substrate phosphosites.
Domain #:
1
Inhibitors
For further details on these inhibitors click on the Compound Name and enter it into DrugKiNET or click on the ID's
Based on in vitro and/or in vivo phosphorylation data
| Compound Name | KD, Ki or IC50 (nM) | PubChem ID | ChEMBL ID | PubMed ID |
|---|
| Momelotinib | IC50 > 2 µM | 25062766 | 19295546 | |
| SureCN4875304 | IC50 > 3.5 µM | 46871765 | 20472445 |
Disease Linkage
General Disease Association:
Immune disorders
Specific Diseases (Non-cancerous):
Whim syndrome
Comments:
The rare immunodeficiency disorder Whim syndrome has symptoms shown in childhood that include recurrent bacterial infections, and progresses to widespread warts later in childhood. The disorder is characterized by an autosomal dominant mutation in the cxcr4 gene. Affected tissues include bone marrow, bone, and b cells. Warts in the genitalia region may progress to cancer.
Gene Expression in Cancers:
TranscriptoNET (www.transcriptonet.ca) analysis with mRNA expression data retrieved from the National Center for Biotechnology Information's Gene Expression Omnibus (GEO) database, which was normalized against 60 abundantly and commonly found proteins, indicated altered expression for this protein kinase as shown here as the percent change from normal tissue controls (%CFC) as supported with the Student T-test in the following types of human cancers: Brain glioblastomas (%CFC= +1730, p<0.0001); Brain oligodendrogliomas (%CFC= +456, p<0.019); Clear cell renal cell carcinomas (cRCC) stage I (%CFC= +288, p<0.0005); and Prostate cancer - primary (%CFC= +57, p<0.001). The COSMIC website notes an up-regulated expression score for BARK2 in diverse human cancers of 365, which is 0.8-fold of the average score of 462 for the human protein kinases. The down-regulated expression score of 14 for this protein kinase in human cancers was 0.2-fold of the average score of 60 for the human protein kinases.
Mutagenesis Experiments:
Insertional mutagenesis studies in mice support a role for this protein kinase in mouse cancer oncogenesis.
Mutation Rate in All Cancers:
Percent mutation rates per 100 amino acids length in human cancers: 0.07 % in 25346 diverse cancer specimens. This rate is only -2 % lower and is very similar to the average rate of 0.075 % calculated for human protein kinases in general.
Mutation Rate in Specific Cancers:
Highest percent mutation rates per 100 amino acids length in human cancers: 0.39 % in 864 skin cancers tested; 0.38 % in 1270 large intestine cancers tested; 0.36 % in 603 endometrium cancers tested; 0.27 % in 589 stomach cancers tested.
Frequency of Mutated Sites:
None > 6 in 20,629 cancer specimens
Comments:
Only 3 deletions, 1 insertion or no complex mutations are noted on the COSMIC website.