
Nomenclature
Short Name:
CTK
Full Name:
Megakaryocyte-associated tyrosine-protein kinase
Alias:
- EC 2.7.1.112
- EC 2.7.10.2
- HYLTK
- HHYLTK
- MGC1708
- MGC2101
- HYL
- MATK
- CHK
- Lsk
Classification
Type:
Protein-tyrosine kinase
Group:
TK
Family:
Csk
SubFamily:
NA

Specific Links
Structure
Mol. Mass (Da):
56,469
# Amino Acids:
507
# mRNA Isoforms:
3
mRNA Isoforms:
56,798 Da (508 AA; P42679-2); 56,469 Da (507 AA; P42679); 51,899 Da (466 AA; P42679-3)
4D Structure:
NA
1D Structure:
3D Image (rendered using PV Viewer):
PDB ID
Subfamily Alignment
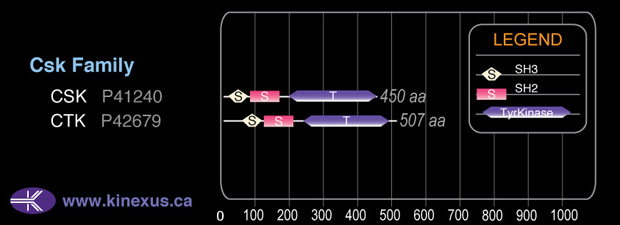
Domain Distribution:
Post-translation Modifications
For detailed information on phosphorylation of this kinase go to PhosphoNET
Serine phosphorylated:
S26, S85, S308, S501, S504.
Threonine phosphorylated:
T76, T500.
Tyrosine phosphorylated:
Y87.
Ubiquitinated:
K116.
Distribution
Based on gene microarray analysis from the NCBI
Human Tissue Distribution
% Max Expression:
Mean Expression:
Number of Samples:
Standard Deviation:
% Max Expression:
Mean Expression:
Number of Samples:
Standard Deviation:
 19
19
648
16
939
 0.2
0.2
8
8
7
 18
18
621
13
2012
 9
9
322
54
507
 16
16
551
13
537
 0.3
0.3
10
37
9
 9
9
313
19
590
 11
11
370
27
608
 9
9
297
10
300
 3
3
121
54
234
 2
2
80
24
207
 13
13
454
104
521
 2
2
76
24
196
 0.2
0.2
6
6
3
 2
2
75
21
230
 0.3
0.3
11
7
6
 0.7
0.7
24
108
44
 5
5
176
19
466
 2
2
78
55
409
 9
9
323
56
373
 2
2
71
20
190
 3
3
106
24
161
 4
4
139
22
378
 3
3
91
18
214
 5
5
157
20
394
 11
11
368
34
502
 3
3
91
27
276
 4
4
134
18
440
 3
3
103
18
318
 2
2
80
14
35
 18
18
630
30
307
 100
100
3459
17
7864
 13
13
433
50
843
 19
19
670
31
654
 2
2
54
40
75
Evolution
Species Conservation
PhosphoNET % Identity:
PhosphoNET % Similarity:
Homologene %
Identity:
PhosphoNET % Identity:
PhosphoNET % Similarity:
Homologene %
Identity:
 100
100
100
100 64.7
64.7
64.7
98 47.1
47.1
64.7
- -
-
-
94 -
-
-
- 56.8
56.8
58.8
94 -
-
-
- 87.2
87.2
92.3
88 82.3
82.3
87.6
89.5 -
-
-
- -
-
-
- 46.9
46.9
65.7
76 34
34
49.3
65 56
56
71.4
63 -
-
-
- 24.8
24.8
33.2
- 40
40
57.6
- -
-
-
- 32.2
32.2
43
- -
-
-
- -
-
-
- -
-
-
31 -
-
-
31 -
-
-
- -
-
-
-
For a wider analysis go to PhosphoNET Evolution in PhosphoNET
Binding Proteins
Examples of known interacting proteins
hiddentext
| No. | Name – UniProt ID |
|---|---|
| 1 | ERBB2 - P04626 |
| 2 | PTK2B - Q14289 |
| 3 | SRC - P12931 |
| 4 | NTRK1 - P04629 |
| 5 | CD36 - P16671 |
| 6 | PXN - P49023 |
Regulation
Activation:
NA
Inhibition:
NA
Synthesis:
NA
Degradation:
NA
Known Downstream Substrates
For further details on these substrates click on the Substrate Short Name or UniProt ID. Phosphosite Location is hyperlinked to PhosphoNET
predictions.
Based on in vitro and/or in vivo phosphorylation data
| Substrate Short Name | UniProt ID (Human) | Phosphosite Location | Phosphosite Sequence | Effect of Phosphorylation |
|---|
Protein Kinase Specificity
Matrix of observed frequency (%) of amino acids in aligned protein substrate phosphosites
Matrix Type:
Predicted from the application of the Kinexus Kinase Substrate Predictor Version 2.0 algorithm, which was trained with over 10,000 kinase-protein substrate pairs and 8,000 kinase-peptide substrate pairs.
Domain #:
1
Inhibitors
For further details on these inhibitors click on the Compound Name and enter it into DrugKiNET or click on the ID's
Based on in vitro and/or in vivo phosphorylation data
| Compound Name | KD, Ki or IC50 (nM) | PubChem ID | ChEMBL ID | PubMed ID |
|---|
| Staurosporine | Kd = 260 nM | 5279 | 22037378 | |
| Lestaurtinib | Kd = 970 nM | 126565 | 22037378 | |
| Aurora A Inhibitor 1 (DF) | Kd = 1 µM | 21992004 | ||
| BML-277 | IC50 > 1 µM | 9969021 | 179583 | 22037377 |
| Ponatinib | IC50 > 1 µM | 24826799 | 20513156 | |
| Tofacitinib | IC50 > 1 µM | 9926791 | 221959 | 22037377 |
| WZ3146 | Kd > 1 µM | 44607360 | 20033049 | |
| WZ4002 | Kd > 1 µM | 44607530 | 20033049 | |
| AST-487 | Kd = 1.3 µM | 11409972 | 574738 | 22037378 |
| TG101348 | Kd = 1.7 µM | 16722836 | 1287853 | 22037378 |
| NVP-TAE684 | Kd = 2.8 µM | 16038120 | 509032 | 22037378 |
| KW2449 | Kd = 3 µM | 11427553 | 1908397 | 22037378 |
| SureCN4875304 | IC50 > 3.5 µM | 46871765 | 20472445 |
Disease Linkage
General Disease Association:
Cancer, bone disorders and eye disorders
Specific Diseases (Non-cancerous):
Spondylolisthesis; Preretinal fibrosis
Comments:
The autoimmune disease, Systemic Lupus Erythematosus, can affect the skin, joints, kidneys, brain, and other tissues.
Specific Cancer Types:
Breast cancer
Comments:
CTK has been suggested to play an inhibitory role in the control of T-cell, which may account for involvement in signalling in some cases of breast cancer.
Gene Expression in Cancers:
TranscriptoNET (www.transcriptonet.ca) analysis with mRNA expression data retrieved from the National Center for Biotechnology Information's Gene Expression Omnibus (GEO) database, which was normalized against 60 abundantly and commonly found proteins, indicated altered expression for this protein kinase as shown here as the percent change from normal tissue controls (%CFC) as supported with the Student T-test in human Gastric cancer (%CFC= -61, p<0.065). The COSMIC website notes an up-regulated expression score for CTK in diverse human cancers of 318, which is 0.7-fold of the average score of 462 for the human protein kinases. The down-regulated expression score of 0 for this protein kinase in human cancers was 100% lower than the average score of 60 for the human protein kinases.
Mutagenesis Experiments:
Insertional mutagenesis studies in mice have not yet revealed a role for this protein kinase in mouse cancer oncogenesis.
Mutation Rate in All Cancers:
Percent mutation rates per 100 amino acids length in human cancers: 0.09 % in 24963 diverse cancer specimens. This rate is only 24 % higher than the average rate of 0.075 % calculated for human protein kinases in general.
Mutation Rate in Specific Cancers:
Highest percent mutation rates per 100 amino acids length in human cancers: 0.46 % in 854 skin cancers tested; 0.45 % in 1093 large intestine cancers tested; 0.44 % in 589 stomach cancers tested; 0.19 % in 1807 lung cancers tested.
Frequency of Mutated Sites:
None > 3 in 20,248 cancer specimens
Comments:
Only 2 deletions, and no insertions or complex mutations are noted on the COSMIC website.