
Nomenclature
Short Name:
PEK
Full Name:
Eukaryotic translation initiation factor 2-alpha kinase 3
Alias:
- E2AK3
- Pancreatic eIF2-alpha kinase
- PRKR-like endoplasmic reticulum kinase
- EC 2.7.11.1
- EIF2AK3
- Eukaryotic translation initiation factor 2-alpha kinase 3
- HsPEK
- PERK
Classification
Type:
Protein-serine/threonine kinase
Group:
Other
Family:
PEK
SubFamily:
PEK

Specific Links
Structure
Mol. Mass (Da):
125216
# Amino Acids:
1116
# mRNA Isoforms:
1
mRNA Isoforms:
125,216 Da (1116 AA; Q9NZJ5)
4D Structure:
Forms dimers with HSPA5/BIP in resting cells. Oligomerizes in ER-stressed cells. Interacts with DNAJC3
1D Structure:
3D Image (rendered using PV Viewer):
PDB ID
Subfamily Alignment
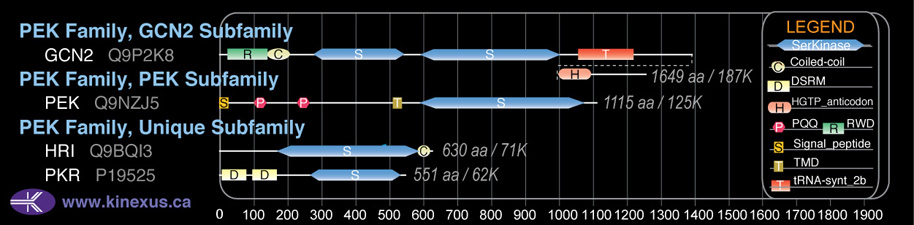
Domain Distribution:
| Start | End | Domain |
|---|---|---|
| 1 | 29 | signal_peptide |
| 103 | 141 | PQQ |
| 233 | 270 | PQQ |
| 517 | 538 | TMD |
| 593 | 1077 | Pkinase |
Kinexus Products
Click on entries below for direct links to relevant products from Kinexus for this protein kinase.
hiddentext
Post-translation Modifications
For detailed information on phosphorylation of this kinase go to PhosphoNET
N-GlcNAcylated:
N258.
Serine phosphorylated:
S447, S455, S555, S567, S688, S694, S715, S719, S803, S804, S844, S845, S854, S856, S1094, S1096, S1109, S1111.
Threonine phosphorylated:
T177, T441, T557, T561, T705, T802+, T982+.
Tyrosine phosphorylated:
Y268, Y464, Y474, Y480, Y481, Y484, Y485+, Y585, Y618+, Y619.
Ubiquitinated:
K622, K669.
Distribution
Based on gene microarray analysis from the NCBI
Human Tissue Distribution
% Max Expression:
Mean Expression:
Number of Samples:
Standard Deviation:
% Max Expression:
Mean Expression:
Number of Samples:
Standard Deviation:
 84
84
1161
22
1225
 7
7
92
9
40
 8
8
116
1
0
 17
17
231
71
305
 55
55
755
21
688
 5
5
75
46
56
 9
9
129
25
123
 24
24
337
19
442
 53
53
725
10
678
 4
4
55
61
49
 6
6
76
16
44
 57
57
789
84
629
 7
7
92
12
20
 6
6
88
6
38
 12
12
166
13
126
 8
8
117
12
123
 21
21
295
85
1914
 14
14
195
6
73
 3
3
38
55
28
 47
47
646
84
710
 4
4
56
12
31
 6
6
82
14
59
 22
22
306
2
250
 3
3
42
6
10
 4
4
57
12
49
 100
100
1379
40
2921
 9
9
123
15
34
 12
12
172
6
69
 7
7
91
6
48
 3
3
39
28
39
 68
68
943
18
544
 39
39
542
26
707
 59
59
810
66
1061
 58
58
795
52
659
 5
5
75
35
67
Evolution
Species Conservation
PhosphoNET % Identity:
PhosphoNET % Similarity:
Homologene %
Identity:
PhosphoNET % Identity:
PhosphoNET % Similarity:
Homologene %
Identity:
 100
100
100
100 99.4
99.4
99.7
99.5 97.8
97.8
98.9
98 -
-
-
90 -
-
-
92 91.8
91.8
95
92 -
-
-
- 87.6
87.6
92.5
88 87.5
87.5
93.2
88 -
-
-
- 75.4
75.4
82.2
- 76.9
76.9
85
82 -
-
-
72 20.8
20.8
24.8
65 -
-
-
- 32.7
32.7
50.9
32 31.1
31.1
48.2
- 22.1
22.1
40.4
26 31.9
31.9
50.9
- -
-
-
- -
-
-
- -
-
-
- -
-
-
- -
-
-
- -
-
-
-
For a wider analysis go to PhosphoNET Evolution in PhosphoNET
Binding Proteins
Examples of known interacting proteins
hiddentext
| No. | Name – UniProt ID |
|---|---|
| 1 | HSP90AA1 - P07900 |
| 2 | HSP90AA2 - Q14568 |
| 3 | DNAJC3 - Q13217 |
| 4 | EIF2S1 - P05198 |
| 5 | HSP90B1 - P14625 |
| 6 | HSPA5 - P11021 |
| 7 | IKBKB - O14920 |
| 8 | TRRAP - Q9Y4A5 |
| 9 | BCL6 - P41182 |
| 10 | NFE2L1 - Q14494 |
Regulation
Activation:
Perturbation in protein folding in the endoplasmic reticulum (ER) promotes reversible dissociation from HSPA5/BIP and oligomerization, resulting in transautophosphorylation and kinase activity induction
Inhibition:
NA
Synthesis:
By ER stress.
Degradation:
NA
Known Upstream Kinases
For further details on these substrates click on the Substrate Short Name or UniProt ID. Phosphosite Location is hyperlinked to PhosphoNET
predictions.
Based on in vitro and/or in vivo phosphorylation data
| Kinase Short Name | UniProt ID (Human) | Phosphosite Location | Phosphosite Sequence | Effect of Phosphorylation |
|---|
Known Downstream Substrates
For further details on these substrates click on the Substrate Short Name or UniProt ID. Phosphosite Location is hyperlinked to PhosphoNET
predictions.
Based on in vitro and/or in vivo phosphorylation data
| Substrate Short Name | UniProt ID (Human) | Phosphosite Location | Phosphosite Sequence | Effect of Phosphorylation |
|---|
Protein Kinase Specificity
Matrix of observed frequency (%) of amino acids in aligned protein substrate phosphosites
Matrix Type:
Predicted from the application of the Kinexus Kinase Substrate Predictor Version 2.0 algorithm, which was trained with over 10,000 kinase-protein substrate pairs and 8,000 kinase-peptide substrate pairs. Note that PERK has a strong preference for phosphorylation of eIF2A due to additional binding sites for this substrate. This additional selectivity in binding eIF2A appear to arise from the Gap 3 and Gap 4 insert regions in the catalytic domain of the protein kinase between Subdomains IV and VI.
Domain #:
1
Inhibitors
For further details on these inhibitors click on the Compound Name and enter it into DrugKiNET or click on the ID's
Based on in vitro and/or in vivo phosphorylation data
| Compound Name | KD, Ki or IC50 (nM) | PubChem ID | ChEMBL ID | PubMed ID |
|---|
| TTT-3002 | IC50 = 100 nM | |||
| BI2536 | IC50 < 600 nM | 11364421 | 513909 | |
| Amgen TBK 1 inhibitor (Compound II) | IC50 < 800 nM | |||
| Staurosporine | IC50 < 4 µM | 5279 | ||
| Staurosporine aglycone | IC50 < 4 µM | 3035817 | 281948 |
Disease Linkage
General Disease Association:
Neurological, and bone disorders
Specific Diseases (Non-cancerous):
Epiphyseal dysplasia multiple with early-onset diabetes mellitus; Brain ischemia
Comments:
An R588Q mutation in PERK leads to almost complete loss of phosphotransferase actvity, and is associated with Wolcott-Rallison syndrome, which is a rare autosomal recessive disorder, characterized by permanent neonatal or early infancy insulin-dependent diabetes and, at a later age, epiphyseal dysplasia, osteoporosis, growth retardation and other multisystem manifestations.
Gene Expression in Cancers:
TranscriptoNET (www.transcriptonet.ca) analysis with mRNA expression data retrieved from the National Center for Biotechnology Information's Gene Expression Omnibus (GEO) database, which was normalized against 60 abundantly and commonly found proteins, indicated altered expression for this protein kinase as shown here as the percent change from normal tissue controls (%CFC) as supported with the Student T-test in the following types of human cancers: Bladder carcinomas (%CFC= +167, p<0.0005); Brain glioblastomas (%CFC= +878, p<0.019); Clear cell renal cell carcinomas (cRCC) stage I (%CFC= -97, p<0.0001); Malignant pleural mesotheliomas (MPM) tumours (%CFC= +54, p<0.023); and Oral squamous cell carcinomas (OSCC) (%CFC= +92, p<0.013). The COSMIC website notes an up-regulated expression score for PERK in diverse human cancers of 425, which is 0.9-fold of the average score of 462 for the human protein kinases. The down-regulated expression score of 16 for this protein kinase in human cancers was 0.3-fold of the average score of 60 for the human protein kinases.
Mutagenesis Experiments:
Insertional mutagenesis studies in mice have not yet revealed a role for this protein kinase in mouse cancer oncogenesis.
Mutation Rate in All Cancers:
Percent mutation rates per 100 amino acids length in human cancers: 0.05 % in 24751 diverse cancer specimens. This rate is only -28 % lower than the average rate of 0.075 % calculated for human protein kinases in general.
Mutation Rate in Specific Cancers:
Highest percent mutation rates per 100 amino acids length in human cancers: 0.23 % in 1270 large intestine cancers tested; 0.2 % in 589 stomach cancers tested; 0.18 % in 548 urinary tract cancers tested; 0.16 % in 603 endometrium cancers tested; 0.15 % in 864 skin cancers tested; 0.15 % in 238 bone cancers tested; 0.08 % in 1634 lung cancers tested; 0.07 % in 273 cervix cancers tested; 0.07 % in 127 biliary tract cancers tested; 0.05 % in 881 prostate cancers tested; 0.05 % in 1512 liver cancers tested; 0.05 % in 1459 pancreas cancers tested; 0.04 % in 1276 kidney cancers tested; 0.03 % in 833 ovary cancers tested; 0.03 % in 710 oesophagus cancers tested; 0.03 % in 1316 breast cancers tested; 0.02 % in 441 autonomic ganglia cancers tested; 0.01 % in 2082 central nervous system cancers tested; 0 % in 2009 haematopoietic and lymphoid cancers tested.
Frequency of Mutated Sites:
None > 5 in 20,035 cancer specimens
Comments:
Only 2 deletions, 1 insertion, and no complex mutations are noted on the COSMIC website.