
Nomenclature
Short Name:
PHKg2
Full Name:
Phosphorylase b kinase gamma catalytic chain, testis-liver isoform
Alias:
- EC 2.7.11.19
- GSD9C
- KPBH
- PHK gamma 2
- Phosphorylase kinase gamma subunit 2
- PSK-C3
Classification
Type:
Protein-serine/threonine kinase
Group:
CAMK
Family:
PHK
SubFamily:
NA

Specific Links
Structure
Mol. Mass (Da):
46442
# Amino Acids:
406
# mRNA Isoforms:
2
mRNA Isoforms:
46,442 Da (406 AA; P15735); 43,158 Da (374 AA; P15735-2)
4D Structure:
Polymer of 16 chains, four each of alpha, beta, gamma, and delta. Alpha and beta are regulatory chains, gamma is the catalytic chain, and delta is calmodulin.
1D Structure:
3D Image (rendered using PV Viewer):
PDB ID
Subfamily Alignment
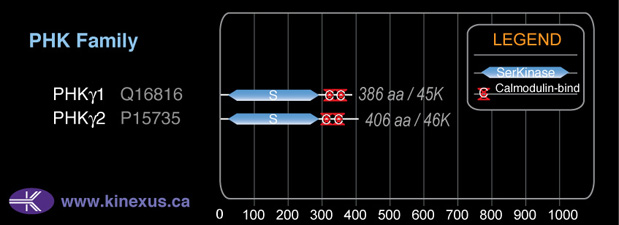
Domain Distribution:
| Start | End | Domain |
|---|---|---|
| 24 | 291 | Pkinase |
| 306 | 330 | CaM_binding |
| 346 | 370 | CaM_binding |
Kinexus Products
Click on entries below for direct links to relevant products from Kinexus for this protein kinase.
hiddentext
Post-translation Modifications
For detailed information on phosphorylation of this kinase go to PhosphoNET
Serine phosphorylated:
S35, S324, S345.
Threonine phosphorylated:
T190, T303.
Tyrosine phosphorylated:
Y24.
Distribution
Based on gene microarray analysis from the NCBI
Human Tissue Distribution
% Max Expression:
Mean Expression:
Number of Samples:
Standard Deviation:
% Max Expression:
Mean Expression:
Number of Samples:
Standard Deviation:
 68
68
1012
31
1400
 4
4
66
10
48
 16
16
237
10
396
 14
14
215
109
428
 37
37
555
28
445
 5
5
68
62
125
 11
11
168
39
441
 78
78
1161
36
3014
 18
18
264
10
217
 11
11
165
53
230
 15
15
229
23
340
 46
46
686
126
652
 12
12
175
21
293
 2
2
26
6
16
 4
4
61
11
50
 2
2
33
17
41
 9
9
130
178
947
 37
37
554
15
1252
 4
4
66
52
64
 30
30
455
102
385
 12
12
172
19
225
 10
10
155
21
248
 13
13
192
19
262
 22
22
324
17
186
 14
14
207
19
314
 100
100
1494
75
2753
 25
25
368
24
1330
 61
61
914
15
2174
 10
10
151
15
241
 2
2
29
14
14
 62
62
932
18
631
 25
25
367
31
525
 16
16
232
78
456
 44
44
661
83
600
 21
21
310
48
397
Evolution
Species Conservation
PhosphoNET % Identity:
PhosphoNET % Similarity:
Homologene %
Identity:
PhosphoNET % Identity:
PhosphoNET % Similarity:
Homologene %
Identity:
 100
100
100
100 74.7
74.7
74.7
100 59.6
59.6
77.6
98 -
-
-
96 -
-
-
92 96.3
96.3
98.5
96 -
-
-
- 93.3
93.3
95.8
94 92.6
92.6
96.3
93 -
-
-
- -
-
-
- 30.7
30.7
48.6
81 29.9
29.9
48.6
80 28.9
28.9
43.1
74.5 -
-
-
- 27.9
27.9
45.1
57 45.1
45.1
62.9
- -
-
-
42 47.1
47.1
66.9
- -
-
-
- -
-
-
- -
-
-
- 26.9
26.9
43.9
- -
-
-
- -
-
-
-
For a wider analysis go to PhosphoNET Evolution in PhosphoNET
Binding Proteins
Examples of known interacting proteins
hiddentext
| No. | Name – UniProt ID |
|---|---|
| 1 | PHKG1 - Q16816 |
Regulation
Activation:
Activated by calcium binding to delta subunit (calmodulin) of the phosphorylase kinase homoloenzyme.
Inhibition:
NA
Synthesis:
NA
Degradation:
NA
Protein Kinase Specificity
Matrix of observed frequency (%) of amino acids in aligned protein substrate phosphosites
Matrix Type:
Predicted from the application of the Kinexus Kinase Substrate Predictor Version 2.0 algorithm, which was trained with over 10,000 kinase-protein substrate pairs and 8,000 kinase-peptide substrate pairs.
Domain #:
1
Inhibitors
For further details on these inhibitors click on the Compound Name and enter it into DrugKiNET or click on the ID's
Based on in vitro and/or in vivo phosphorylation data
| Compound Name | KD, Ki or IC50 (nM) | PubChem ID | ChEMBL ID | PubMed ID |
|---|
Disease Linkage
General Disease Association:
Metabolic disorders
Specific Diseases (Non-cancerous):
Glycogen storage disease; Glycogen storage disease Ixc; Phosphorylase kinase deficiency; Glycogen storage disease, Type 1xa1; Cirrhosis due to liver phosphorylase kinase deficiency; PHKG2-related phosphorylase kinase deficiency
Comments:
Loss-of-function mutations (mainly truncating or frameshift mutations) in the protein have been linked to glycogen storage disease, PDK deficiency, and an increased risk of liver cirrhosis. Glycogen storage disease is a metabolic disease resulting from mutations to the glycogen metabolic enzymes (including PHK) that result in abnormal glycogen regulation and metabolism. Glycogen storage disease mostly effect the liver and muscles. Common symptoms of this disease are muscle weakness, fatigue, and low blood sugar levels resulting from a reduced capacity to mobilize glycogen reserves.
Comments:
PHKg2 may be a tumour requiring protein (TRP), since it displays extremely a very low rate of mutation in human cancers. Only 2 mutations in 24,726.
Gene Expression in Cancers:
TranscriptoNET (www.transcriptonet.ca) analysis with mRNA expression data retrieved from the National Center for Biotechnology Information's Gene Expression Omnibus (GEO) database, which was normalized against 60 abundantly and commonly found proteins, indicated altered expression for this protein kinase as shown here as the percent change from normal tissue controls (%CFC) as supported with the Student T-test in the following types of human cancers: Brain glioblastomas (%CFC= +316, p<0.0001); Breast epithelial cell carcinomas (%CFC= +61, p<0.017); Lung adenocarcinomas (%CFC= +130, p<0.003); Malignant pleural mesotheliomas (MPM) tumours (%CFC= +434, p<0.0001); Prostate cancer - primary (%CFC= +116, p<0.0008). The COSMIC website notes an up-regulated expression score for PHKg2 in diverse human cancers of 540, which is 1.2-fold of the average score of 462 for the human protein kinases. The down-regulated expression score of 13 for this protein kinase in human cancers was 0.2-fold of the average score of 60 for the human protein kinases.
Mutagenesis Experiments:
Insertional mutagenesis studies in mice have not yet revealed a role for this protein kinase in mouse cancer oncogenesis.
Mutation Rate in All Cancers:
Percent mutation rates per 100 amino acids length in human cancers: 0 % in 24726 diverse cancer specimens. This rate is -97 % lower than the average rate of 0.075 % calculated for human protein kinases in general. Such a very low frequency of mutation in human cancers is consistent with this protein kinase playing a role as a tumour requiring protein (TRP).
Mutation Rate in Specific Cancers:
Highest percent mutation rates per 100 amino acids length in human cancers: 0.03 % in 864 skin cancers tested; 0.03 % in 833 ovary cancers tested.
Frequency of Mutated Sites:
None > 1 in 20,009 cancer specimens
Comments:
No deletions, insertions or complex mutations are noted on the COSMIC website.