
Nomenclature
Short Name:
PKN3
Full Name:
PRKCL3
Alias:
- EC 2.7.11.13
- PKN-beta
- PRKCL3
- Serine,threonine-protein kinase N3
Classification
Type:
Protein-serine/threonine kinase
Group:
AGC
Family:
PKN
SubFamily:
NA

Structure
Mol. Mass (Da):
99,421
# Amino Acids:
889
# mRNA Isoforms:
1
mRNA Isoforms:
99,421 Da (889 AA; Q6P5Z2)
4D Structure:
NA
1D Structure:
Subfamily Alignment
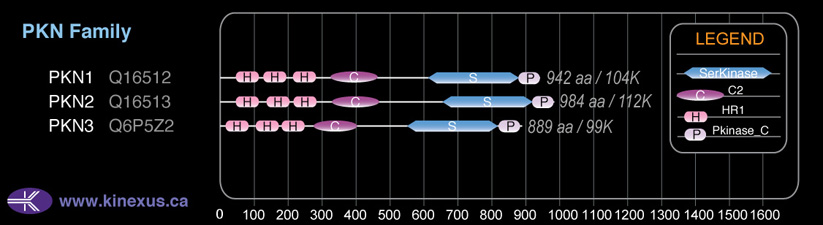
Domain Distribution:
Post-translation Modifications
For detailed information on phosphorylation of this kinase go to PhosphoNET
Acetylated:
K583.
Serine phosphorylated:
S171, S299, S307, S466, S472, S488, S494, S524, S544, S548, S717+.
Threonine phosphorylated:
T135, T480, T492, T508, T523, T527, T550, T716+, T718+, T722-, T820, T860.
Ubiquitinated:
K686.
Distribution
Based on gene microarray analysis from the NCBI
Human Tissue Distribution
% Max Expression:
Mean Expression:
Number of Samples:
Standard Deviation:
% Max Expression:
Mean Expression:
Number of Samples:
Standard Deviation:
 100
100
1036
9
966
 18
18
188
6
322
 15
15
154
17
221
 33
33
346
58
1005
 62
62
639
13
587
 2
2
25
9
11
 0.8
0.8
8
13
6
 39
39
409
34
1363
 0.8
0.8
8
3
3
 14
14
148
55
244
 19
19
202
32
383
 33
33
339
50
430
 20
20
205
21
303
 31
31
323
5
560
 23
23
236
13
585
 12
12
129
7
238
 5
5
53
187
106
 19
19
199
24
344
 23
23
240
42
720
 56
56
577
33
363
 11
11
113
34
150
 9
9
95
31
146
 15
15
151
20
193
 19
19
197
26
335
 13
13
138
32
220
 34
34
350
46
497
 25
25
261
26
706
 25
25
255
26
467
 13
13
130
25
163
 11
11
113
14
67
 73
73
761
12
122
 86
86
894
13
2082
 29
29
305
41
732
 75
75
778
26
676
 2
2
20
22
20
Evolution
Species Conservation
PhosphoNET % Identity:
PhosphoNET % Similarity:
Homologene %
Identity:
PhosphoNET % Identity:
PhosphoNET % Similarity:
Homologene %
Identity:
 100
100
100
100 97.8
97.8
97.9
99.5 81.5
81.5
83
97.5 -
-
-
90 -
-
-
93 84.2
84.2
87.7
90 -
-
-
- 83.2
83.2
88.4
84 50
50
63.6
- -
-
-
- 64.3
64.3
72.9
- 49
49
63.1
62 26.2
26.2
36.7
59.5 52.2
52.2
67.7
- -
-
-
- 28
28
41.5
- -
-
-
- 29.1
29.1
44
- 41.5
41.5
58.3
- -
-
-
- -
-
-
- -
-
-
- -
-
-
- 25.3
25.3
41.8
- 27.1
27.1
43.3
-
For a wider analysis go to PhosphoNET Evolution in PhosphoNET
Binding Proteins
Examples of known interacting proteins
hiddentext
| No. | Name – UniProt ID |
|---|---|
| 1 | PLD1 - Q13393 |
| 2 | ARHGAP10 - A1A4S6 |
| 3 | ARHGAP26 - Q9UNA1 |
Regulation
Activation:
Two specific sites, Thr-718 (activation loop of the kinase domain) and Thr-860 (turn motif), need to be phosphorylated for its full activation.
Inhibition:
NA
Synthesis:
NA
Degradation:
NA
Protein Kinase Specificity
Matrix of observed frequency (%) of amino acids in aligned protein substrate phosphosites
Matrix Type:
Predicted from the application of the Kinexus Kinase Substrate Predictor Version 2.0 algorithm, which was trained with over 10,000 kinase-protein substrate pairs and 8,000 kinase-peptide substrate pairs.
Domain #:
1
Disease Linkage
General Disease Association:
Cancer
Specific Cancer Types:
Prostate cancer
Comments:
PKN3 has been implicated in playing a role in inducing tissue invasion with prostate cancer.
Gene Expression in Cancers:
TranscriptoNET (www.transcriptonet.ca) analysis with mRNA expression data retrieved from the National Center for Biotechnology Information's Gene Expression Omnibus (GEO) database, which was normalized against 60 abundantly and commonly found proteins, indicated altered expression for this protein kinase as shown here as the percent change from normal tissue controls (%CFC) as supported with the Student T-test in the following types of human cancers: Brain oligodendrogliomas (%CFC= -89, p<0.021); Breast epithelial carcinomas (%CFC= -64, p<0.001); and Large B-cell lymphomas (%CFC= +143, p<0.047). The COSMIC website notes an up-regulated expression score for PKN3 in diverse human cancers of 387, which is 0.8-fold of the average score of 462 for the human protein kinases. The down-regulated expression score of 9 for this protein kinase in human cancers was 0.2-fold of the average score of 60 for the human protein kinases.
Mutagenesis Experiments:
Insertional mutagenesis studies in mice have not yet revealed a role for this protein kinase in mouse cancer oncogenesis.
Mutation Rate in All Cancers:
Percent mutation rates per 100 amino acids length in human cancers: 0.06 % in 24914 diverse cancer specimens. This rate is only -14 % lower than the average rate of 0.075 % calculated for human protein kinases in general.
Mutation Rate in Specific Cancers:
Highest percent mutation rates per 100 amino acids length in human cancers: 0.42 % in 1270 large intestine cancers tested; 0.39 % in 864 skin cancers tested; 0.23 % in 589 stomach cancers tested; 0.12 % in 548 urinary tract cancers tested; 0.09 % in 238 bone cancers tested; 0.08 % in 1822 lung cancers tested; 0.07 % in 603 endometrium cancers tested; 0.06 % in 710 oesophagus cancers tested; 0.06 % in 1276 kidney cancers tested; 0.04 % in 273 cervix cancers tested; 0.04 % in 1512 liver cancers tested; 0.04 % in 1316 breast cancers tested; 0.02 % in 2082 central nervous system cancers tested; 0.01 % in 942 upper aerodigestive tract cancers tested; 0.01 % in 2009 haematopoietic and lymphoid cancers tested; 0.01 % in 1459 pancreas cancers tested.
Frequency of Mutated Sites:
Most frequent mutations with the number of reports indicated in brackets: R258W (3).
Comments:
Only 8 deletions, 2 insertions and no complex mutations are noted on the COSMIC website.