
Nomenclature
Short Name:
PLK2
Full Name:
Serine-threonine-protein kinase PLK2
Alias:
- EC 2.7.11.21
- SNK
- Polo-like kinase 2
- Serine/threonine-protein kinase SNK
- Serum inducible kinase
- Serum-inducible kinase
Classification
Type:
Protein-serine/threonine kinase
Group:
Other
Family:
PLK
SubFamily:
NA

Structure
Mol. Mass (Da):
78,237
# Amino Acids:
685
# mRNA Isoforms:
1
mRNA Isoforms:
78,237 Da (685 AA; Q9NYY3)
4D Structure:
NA
1D Structure:
3D Image (rendered using PV Viewer):
PDB ID
Subfamily Alignment
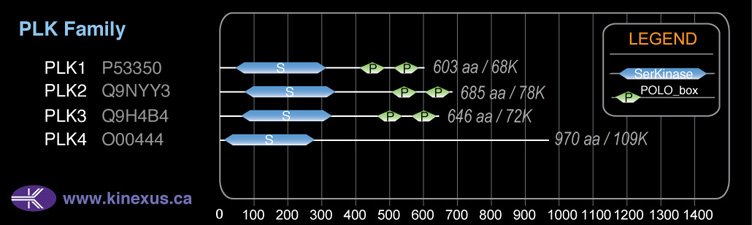
Domain Distribution:
Post-translation Modifications
For detailed information on phosphorylation of this kinase go to PhosphoNET
Methylated:
K366.
Threonine phosphorylated:
T100+, T239+, T243-.
Tyrosine phosphorylated:
Y108, Y184, Y185+, Y246-, Y271, Y297.
Ubiquitinated:
K207, K317, K375, K390, K438.
Distribution
Based on gene microarray analysis from the NCBI
Human Tissue Distribution
% Max Expression:
Mean Expression:
Number of Samples:
Standard Deviation:
% Max Expression:
Mean Expression:
Number of Samples:
Standard Deviation:
 11
11
822
16
970
 0.3
0.3
24
10
11
 23
23
1672
13
3479
 15
15
1076
58
1160
 17
17
1207
14
796
 2
2
147
41
158
 4
4
279
19
476
 14
14
1040
32
1589
 4
4
325
10
317
 5
5
375
57
2024
 11
11
779
25
2662
 13
13
929
107
1188
 11
11
817
24
2428
 0.8
0.8
61
9
25
 9
9
669
23
1294
 0.4
0.4
31
8
21
 3
3
217
113
1196
 14
14
1030
20
1977
 3
3
192
55
685
 12
12
860
56
817
 11
11
784
22
2716
 30
30
2204
24
3761
 17
17
1228
14
2605
 21
21
1494
20
2192
 10
10
699
22
2283
 12
12
899
40
1514
 9
9
624
27
1933
 20
20
1431
20
2688
 21
21
1555
20
2736
 0.2
0.2
15
14
9
 5
5
398
18
292
 100
100
7273
21
11775
 11
11
782
52
1060
 12
12
876
26
762
 6
6
416
22
432
Evolution
Species Conservation
PhosphoNET % Identity:
PhosphoNET % Similarity:
Homologene %
Identity:
PhosphoNET % Identity:
PhosphoNET % Similarity:
Homologene %
Identity:
 100
100
100
100 0
0
0
100 97.3
97.3
97.3
100 -
-
-
98 -
-
-
99 97.6
97.6
98.2
97 -
-
-
- 96.7
96.7
97.5
97 97
97
97.8
97 -
-
-
- -
-
-
- 86.7
86.7
91.2
89 37.5
37.5
57.3
84 -
-
-
77 -
-
-
- 33.2
33.2
54.8
- -
-
-
- 27
27
44.9
- -
-
-
- -
-
-
- 31
31
50.6
- -
-
-
- -
-
-
- 31.7
31.7
50
- -
-
-
-
For a wider analysis go to PhosphoNET Evolution in PhosphoNET
Regulation
Activation:
NA
Inhibition:
NA
Synthesis:
NA
Degradation:
NA
Known Downstream Substrates
For further details on these substrates click on the Substrate Short Name or UniProt ID. Phosphosite Location is hyperlinked to PhosphoNET
predictions.
Based on in vitro and/or in vivo phosphorylation data
| Substrate Short Name | UniProt ID (Human) | Phosphosite Location | Phosphosite Sequence | Effect of Phosphorylation |
|---|
Protein Kinase Specificity
Matrix of observed frequency (%) of amino acids in aligned protein substrate phosphosites
Matrix Type:
Predicted from the application of the Kinexus Kinase Substrate Predictor Version 2.0 algorithm, which was trained with over 10,000 kinase-protein substrate pairs and 8,000 kinase-peptide substrate pairs.
Domain #:
1
Inhibitors
For further details on these inhibitors click on the Compound Name and enter it into DrugKiNET or click on the ID's
Based on in vitro and/or in vivo phosphorylation data
| Compound Name | KD, Ki or IC50 (nM) | PubChem ID | ChEMBL ID | PubMed ID |
|---|
Disease Linkage
General Disease Association:
Cancer
Specific Cancer Types:
Burkitt lymphomas (BL); B-cell lymphomas
Comments:
PLK2 might be a tumour suppressor protein (TSP) that has a role in the duplication of centrioles, G1/S phase transition, and synaptic plasticity. The synaptic plasticity modulation is a kinase phosphotransferase activity-independent activity. Burkitt Lymphoma (BL) is a B-cell lymphoma where cells in the tumour originally arise from one cell. All of the resulting B cells would theoretically have the same IgH gene.
Gene Expression in Cancers:
TranscriptoNET (www.transcriptonet.ca) analysis with mRNA expression data retrieved from the National Center for Biotechnology Information's Gene Expression Omnibus (GEO) database, which was normalized against 60 abundantly and commonly found proteins, indicated altered expression for this protein kinase as shown here as the percent change from normal tissue controls (%CFC) as supported with the Student T-test in the following types of human cancers: Bladder carcinomas (%CFC= +93, p<0.034); Cervical epithelial cancer (%CFC= +52, p<0.047); Cervical cancer (%CFC= +175, p<(0.0003); Clear cell renal cell carcinomas (cRCC) (%CFC= +204, p<0.024); Colorectal adenocarcinomas (early onset) (%CFC= +53, p<0.026); Malignant pleural mesotheliomas (MPM) tumours (%CFC= +233, p<0.0001); Ovary adenocarcinomas (%CFC= -45, p<0.004); Skin melanomas - malignant (%CFC= -53, p<0.012); and Skin squamous cell carcinomas (%CFC= +67, p<0.073). The COSMIC website notes an up-regulated expression score for PLK2 in diverse human cancers of 310, which is 0.7-fold of the average score of 462 for the human protein kinases. The down-regulated expression score of 0 for this protein kinase in human cancers was 100% lower than the average score of 60 for the human protein kinases.
Mutagenesis Experiments:
Insertional mutagenesis studies in mice have not yet revealed a role for this protein kinase in mouse cancer oncogenesis. PLK2 phosphotransferase activity can be abrogated with an N210A mutation. The W503F, H629A, and K631M mutations, in conjunction, lead to impaired centrosome localization of PLK2 and impaired centriole duplication.
Mutation Rate in All Cancers:
Percent mutation rates per 100 amino acids length in human cancers: 0.08 % in 24802 diverse cancer specimens. This rate is very similar (+ 3% higher) to the average rate of 0.075 % calculated for human protein kinases in general.
Mutation Rate in Specific Cancers:
Highest percent mutation rates per 100 amino acids length in human cancers: 0.45 % in 1093 large intestine cancers tested; 0.34 % in 602 endometrium cancers tested; 0.29 % in 805 skin cancers tested; 0.12 % in 1670 lung cancers tested; 0.11 % in 1270 liver cancers tested.
Frequency of Mutated Sites:
None > 7 in 20,085 cancer specimens
Comments:
Eleven deletion mutations as well as 3 insertions mutations observed at L335, which is at the end of the protein kinase catalytic domain.