
Nomenclature
Short Name:
ROCK1
Full Name:
Rho-associated protein kinase 1
Alias:
- EC 2.7.11.1
- Kinase ROCK1
- ROK-beta
- P160ROCK
- Rho-associated, coiled-coil containing protein kinase 1
- Rho-associated, coiled-coil forming protein kinase p160 ROCK-1
- ROCK-I
Classification
Type:
Protein-serine/threonine kinase
Group:
AGC
Family:
DMPK
SubFamily:
ROCK

Specific Links
Structure
Mol. Mass (Da):
158,175
# Amino Acids:
1354
# mRNA Isoforms:
1
mRNA Isoforms:
158,175 Da (1354 AA; Q13464)
4D Structure:
Binds RHOA (activated by GTP). Interacts with ADD1, GEM, RHOB, RHOC, MYLC2B and VIM By similarity. Binds RHOE, PPP1R12A, LIMK1 and LIMK2. Interacts with TSG101. Interacts with DAPK3
1D Structure:
3D Image (rendered using PV Viewer):
PDB ID
Subfamily Alignment
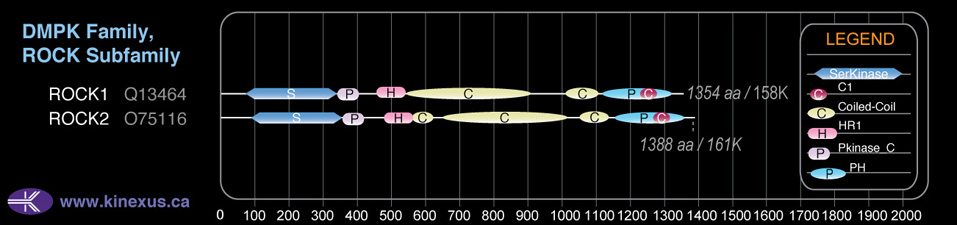
Domain Distribution:
| Start | End | Domain |
|---|---|---|
| 76 | 338 | Pkinase |
| 341 | 409 | Pkinase_C |
| 458 | 542 | HR1 |
| 543 | 904 | Coiled-coil |
| 1016 | 1100 | Coiled-coil |
| 1119 | 1319 | PH |
| 1229 | 1281 | C1 |
Kinexus Products
Click on entries below for direct links to relevant products from Kinexus for this protein kinase.
hiddentext
Post-translation Modifications
For detailed information on phosphorylation of this kinase go to PhosphoNET
Acetylated:
K647 (N6), K1194.
Serine phosphorylated:
S282, S407, S456, S533, S567, S572, S574, S576, S679, S710, S742, S1098, S1100, S1102, S1105, S1108, S1119, S1328, S1333+, S1336, S1341.
Threonine phosphorylated:
T3, T398, T455, T569, T887, T890, T897, T917, T1024, T1101, T1112, T1180, T1189, T1331, T1334, T1337.
Tyrosine phosphorylated:
Y255+, Y405, Y603, Y604, Y913, Y1153, Y1287.
Ubiquitinated:
K200.
Distribution
Based on gene microarray analysis from the NCBI
Human Tissue Distribution
% Max Expression:
Mean Expression:
Number of Samples:
Standard Deviation:
% Max Expression:
Mean Expression:
Number of Samples:
Standard Deviation:
 43
43
1031
44
798
 2
2
59
17
52
 23
23
553
31
400
 19
19
454
170
801
 41
41
1001
39
729
 8
8
189
99
251
 9
9
224
51
413
 25
25
594
71
1111
 36
36
870
17
691
 7
7
159
155
186
 10
10
237
54
249
 34
34
831
200
718
 16
16
381
53
308
 5
5
131
12
111
 5
5
112
21
81
 4
4
99
25
117
 5
5
110
286
155
 9
9
213
39
216
 5
5
112
142
110
 31
31
738
165
677
 10
10
233
48
204
 13
13
316
51
316
 13
13
306
33
250
 9
9
208
40
169
 12
12
285
48
299
 32
32
764
116
838
 11
11
262
56
200
 10
10
235
40
200
 15
15
359
40
335
 3
3
77
56
55
 34
34
830
24
410
 31
31
755
40
742
 11
11
260
98
443
 45
45
1094
104
804
 100
100
2415
61
4337
Evolution
Species Conservation
PhosphoNET % Identity:
PhosphoNET % Similarity:
Homologene %
Identity:
PhosphoNET % Identity:
PhosphoNET % Similarity:
Homologene %
Identity:
 100
100
100
100 74
74
74
100 99.6
99.6
99.8
100 -
-
-
97 -
-
-
96 65.3
65.3
66.5
98 -
-
-
- 96.6
96.6
98.7
97 94.8
94.8
97.4
96 -
-
-
- 58.3
58.3
72.6
- 87.3
87.3
94.3
87.5 64.4
64.4
80.4
83 62.4
62.4
79.5
76 -
-
-
- 24.4
24.4
45.9
44 -
-
-
- -
-
-
- 47.6
47.6
66.3
- -
-
-
- -
-
-
- -
-
-
- -
-
-
- -
-
-
- -
-
-
-
For a wider analysis go to PhosphoNET Evolution in PhosphoNET
Regulation
Activation:
Activated by RHOA binding.
Inhibition:
NA
Synthesis:
NA
Degradation:
NA
Known Downstream Substrates
For further details on these substrates click on the Substrate Short Name or UniProt ID. Phosphosite Location is hyperlinked to PhosphoNET
predictions.
Based on in vitro and/or in vivo phosphorylation data
| Substrate Short Name | UniProt ID (Human) | Phosphosite Location | Phosphosite Sequence | Effect of Phosphorylation |
|---|
| ADD1 | P35611 | T445 | QKQQREKTRWLNSGR | |
| Calponin 1 | P51911 | S175 | MGTNKFASQQGMTAY | |
| Calponin 1 | P51911 | T170 | IIGLQMGTNKFASQQ | |
| Calponin 1 | P51911 | T180 | FASQQGMTAYGTRRH | |
| Calponin 1 | P51911 | T184 | QGMTAYGTRRHLYDP | |
| Calponin 1 | P51911 | T259 | GASQRGMTVYGLPRQ | |
| CRMP-2 (DPYSL2) | Q16555 | T555 | DNIPRRTTQRIVAPP | |
| CRMP2 (DPYSL2) | Q16555 | T555 | DNIPRRTTQRIVAPP | |
| DAPK3 | O43293 | T265 | KDPKRRMTIAQSLEH | + |
| DAPK3 | O43293 | T299 | PERRRLKTTRLKEYT | + |
| Desmin | P17661 | S11 | YSSSQRVSSYRRTFG | |
| Desmin | P17661 | S59 | VYQVSRTSGGAGGLG | |
| Desmin | P17661 | T16 | RVSSYRRTFGGAPGF | |
| Desmin | P17661 | T75 | LRASRLGTTRTPSSY | |
| Desmin | P17661 | T76 | RASRLGTTRTPSSYG | |
| Endophilin 1 | Q99962 | T14 | KKQFHKATQKVSEKV | |
| Ezrin | P15311 | T567 | QGRDKYKTLRQIRQG | |
| FAK (PTK2) | Q05397 | S732 | SSEGFYPSPQHMVQT | ? |
| FAK (PTK2) | Q05397 | Y407 | IIDEEDTYTMPSTRD | + |
| FHOD1 | Q9Y613 | S1130 | AARERKRSRGNRKSL | |
| FHOD1 | Q9Y613 | S1136 | RSRGNRKSLRRTLKS | |
| FHOD1 | Q9Y613 | T1140 | NRKSLRRTLKSGLGD | |
| GFAP | P14136 | S13 | ITSAARRSYVSSGEM | |
| GFAP | P14136 | S38 | LGPGTRLSLARMPPP | |
| GFAP | P14136 | T7 | _MERRRITSAARRSY | |
| GRF1 | Q9NRY4 | S1150 | LERGRKVSIVSKPVL | |
| GRF1 | Q9NRY4 | S1174 | RFASYRTSFSVGSDD | |
| GRF1 | Q9NRY4 | S1236 | PKPKPRPSITKATWE | |
| GRF1 | Q9NRY4 | T1173 | GRFASYRTSFSVGSD | |
| GRF1 | Q9NRY4 | T1226 | LRSLRRNTKKPKPKP | |
| H3.1 | P68431 | S11 | TKQTARKSTGGKAPR | + |
| H3.1 | P68431 | S29 | ATKAARKSAPATGGV | |
| IRS1 | P35568 | S307 | TRRSRTESITATSPA | - |
| IRS1 | P35568 | S362 | NGDYMPMSPKSVSAP | |
| IRS1 | P35568 | S639 | YMPMSPKSVSAPQQI | - |
| LIMK1 | P53667 | T508 | PDRKKRYTVVGNPYW | + |
| LIMK2 | P53671 | T505 | NDRKKRYTVVGNPYW | + |
| MARCKS | P29966 | S159 | KKKKKRFSFKKSFKL | |
| Moesin | P26038 | T558 | LGRDKYKTLRQIRQG | |
| MRLC1 (MYL9) | P24844 | S20 | KRPQRATSNVFAMFD | |
| MRLC1 (MYL9) | P24844 | T19 | KKRPQSATSNVFAMF | |
| MRLC2 (MYL12B) | P19105 | S2 | _______SSKRTKTK | + |
| MRLC2 (MYL12B) | P19105 | S20 | KRPQRATSNVFAMFD | |
| MRLC2 (MYL12B) | P19105 | S3 | _____MSSKRTKTKT | + |
| MRLC2 (MYL12B) | P19105 | T135 | TTMGDRFTDEEVDEL | |
| MRLC2 (MYL12B) | P19105 | T19 | KKRPQRATSNVFAMF | + |
| MRLC2 (MYL12B) | P19105 | Y156 | DKKGNFNYIEFTRIL | |
| MYPT1 | O14974 | S852 | RPREKRRSTGVSFWT | |
| MYPT1 | O14974 | T696 | ARQSRRSTQGVTLTD | |
| MYPT1 | O14974 | T853 | PREKRRSTGVSFWTQ | |
| NFL (Neurofilament L) | P07196 | S27 | ETPRVHISSVRSGYS | |
| NFL (Neurofilament L) | P07196 | S58 | LSVRRSYSSSSGSLM | |
| PARD3 | Q8TEW0 | T833 | QSMSEKRTKQFSDAS | |
| PFN1 | P07737 | S137 | MASHLRRSQY_____ | |
| PPP1R12B | O60237 | T646 | ARQTRRSTQGVTLTD | |
| PPP1R14A (CPI 17) | Q96A00 | T38 | QKRHARVTVKYDRRE | - |
| PTEN | P60484 | S229 | VKIYSSNSGPTRRED | ? |
| PTEN | P60484 | T232 | YSSNSGPTRREDKFM | ? |
| Radixin | P35241 | T564 | AGRDKYKTLRQIRQG | |
| RhoE | P61587 | S11 | RRASQKLSSKSIMDP | |
| RhoE | P61587 | S7 | _MKERRASQKLSSKS | |
| STX1A | Q16623 | S14 | ELRTAKDSDDDDDVA | |
| Tau iso8 | P10636-8 | S262 | NVKSKIGSTENLKHQ | |
| Tau iso9 (Tau-F) | P10636-9 | S409 | GTSPRHLSNVSSTGS | |
| TIAM2 | Q8IVF5-2 | T1677 | STKRDRGTLLKAQIR | |
| Vimentin | P08670 | S39 | TTSTRTYSLGSALRP | |
| Vimentin | P08670 | S72 | SSAVRLRSSVPGVRL |
Protein Kinase Specificity
Matrix of observed frequency (%) of amino acids in aligned protein substrate phosphosites
Matrix Type:
Experimentally derived from alignment of 84 known protein substrate phosphosites and 14 peptides phosphorylated by recombinant ROCK1 in vitro tested in-house by Kinexus.
Domain #:
1
Inhibitors
For further details on these inhibitors click on the Compound Name and enter it into DrugKiNET or click on the ID's
Based on in vitro and/or in vivo phosphorylation data
| Compound Name | KD, Ki or IC50 (nM) | PubChem ID | ChEMBL ID | PubMed ID |
|---|
Disease Linkage
General Disease Association:
Cancer, testicular disorders
Specific Diseases (Non-cancerous):
46,xx Testicular disorder of sex development; Sry-negative 46,xx Testicular disorder of sex development
Specific Cancer Types:
Gliomas; Gastric cancer
Comments:
Down-regulating ROCK1 may be useful for inhibiting migration and invasion of glioma and gastric cancer.
Gene Expression in Cancers:
TranscriptoNET (www.transcriptonet.ca) analysis with mRNA expression data retrieved from the National Center for Biotechnology Information's Gene Expression Omnibus (GEO) database, which was normalized against 60 abundantly and commonly found proteins, indicated altered expression for this protein kinase as shown here as the percent change from normal tissue controls (%CFC) as supported with the Student T-test in the following types of human cancers: Bladder carcinomas (%CFC= +55, p<0.005); Brain glioblastomas (%CFC= -70, p<0.0007); Brain oligodendrogliomas (%CFC= -70, p<0.0007); Clear cell renal cell carcinomas (cRCC) stage I (%CFC= -96, p<0.0001); and Ovary adenocarcinomas (%CFC= -59, p<0.039).
Mutagenesis Experiments:
Insertional mutagenesis studies in mice have not yet revealed a role for this protein kinase in mouse cancer oncogenesis .A D1113A substitution in ROCK1 can abolish the ability of caspase-3 to cleave this protein kinase.
Mutation Rate in All Cancers:
Percent mutation rates per 100 amino acids length in human cancers: 0.07 % in 24433 diverse cancer specimens. This rate is only -12 % lower than the average rate of 0.075 % calculated for human protein kinases in general.
Mutation Rate in Specific Cancers:
Highest percent mutation rates per 100 amino acids length in human cancers: 0.49 % in 15 pituitary cancers tested; 0.37 % in 1270 large intestine cancers tested; 0.24 % in 589 stomach cancers tested; 0.16 % in 273 cervix cancers tested; 0.14 % in 864 skin cancers tested; 0.13 % in 603 endometrium cancers tested; 0.12 % in 1634 lung cancers tested; 0.11 % in 548 urinary tract cancers tested; 0.08 % in 1512 liver cancers tested; 0.06 % in 1316 breast cancers tested; 0.06 % in 1276 kidney cancers tested; 0.06 % in 125 biliary tract cancers tested; 0.05 % in 881 prostate cancers tested; 0.05 % in 710 oesophagus cancers tested; 0.04 % in 382 soft tissue cancers tested; 0.03 % in 942 upper aerodigestive tract cancers tested; 0.02 % in 833 ovary cancers tested; 0.02 % in 441 autonomic ganglia cancers tested; 0.02 % in 1459 pancreas cancers tested; 0.01 % in 2103 central nervous system cancers tested; 0.01 % in 2009 haematopoietic and lymphoid cancers tested.
Frequency of Mutated Sites:
Most frequent mutations with the number of reports indicated in brackets: E270K (4); R58S (3); R1012Q (3).
Comments:
Twenty-one deletions (12 at K1307fs*3), 4 insertions and no complex mutations are noted on the COSMIC website.