• KinATLAS
  • TranscriptoNET
  • PhosphoNET
  • OncoNET
  • KinaseNET
  • DrugKiNET
  • DrugProNET
  • KiNET-AM
  • Kinetica Online

Updated November 2019

Home | Kinexus | Contact | Credits

Nomenclature

Short Name:
TRKC
Full Name:
NT-3 growth factor receptor
Alias:
  • EC 2.7.10.1
  • GP145-TrkC
  • NT-3 growth factor receptor
  • NTRK3
  • TRKC
  • TrkC tyrosine kinase
  • Kinase TrkC
  • Neurotrophic tyrosine kinase receptor 3
  • Neurotrophic tyrosine kinase, receptor, type 3
  • Neurotrophin-3 receptor non-catalytic isoform 1

Classification

Type:
Protein-tyrosine kinase
Group:
TK
Family:
Trk
SubFamily:
NA


Specific Links

Entrez-Gene Entry: 4916
Entrez-Protein Entry: NP_002521
GeneCards Entry: TRKC
KinBASE Entry: TRKC
OMIM Entry: 191316
Pfam Entry: Q16288
PhosphoNET Entry: Q16288
Phosphosite Plus Entry: 1978
Protein Data Bank Entry: 1WWC
Source Entry: NTRK3
UCSD-Nature Entry: A002321
UniProt Entry: Q16288
Kinexus Products: TRKC
NT-3 growth factor receptor Y709+Y710 phosphosite-specific antibody AB-PK840
NT-3 growth factor receptor (S706-F713, human) pY709+pY710 phosphopeptide - Powder PE-04AHW95

General Links

ClustalW2
GPS-Cuckoo
Human Protein Atlas
Kinase.com
Kinase Research
Kinasource
Kinomer
Netphorest
NetworKIN
Phosida
PhosphoElm
Protein Blast
ScanSite
String

Structure

Mol. Mass (Da):
94428
# Amino Acids:
839
# mRNA Isoforms:
5
mRNA Isoforms:
94,428 Da (839 AA; Q16288); 93,460 Da (831 AA; Q16288-4); 92,801 Da (825 AA; Q16288-3); 91,833 Da (817 AA; Q16288-5); 68,452 Da (612 AA; Q16288-2)
4D Structure:
Exists in a dynamic equilibrium between monomeric (low affinity) and dimeric (high affinity) structures. Binds SH2B2. Interacts with SQSTM1 and KIDINS220
1D Structure:
Retrieve Gene Sequence
Retrieve Full Protein Sequence
Retrieve Catalytic Domain Sequence
 
3D Image (rendered using PV Viewer):

PDB ID
3V5Q

Subfamily Alignment
subfamily domain
 
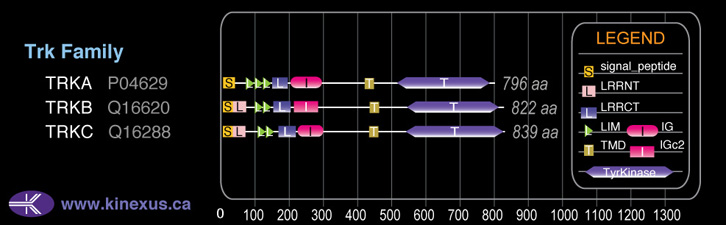
Domain Distribution:
Start End Domain
1 32 signal_peptide
31 58 LRRNT
104 127 LRR
128 150 LRR
160 208 LRRCT
210 300 IG
430 452 TMD
538 824 TyrKc
309 382 IG
538 826 Pkinase
 

Kinexus Products

Click on entries below for direct links to relevant products from Kinexus for this protein kinase.
hiddentext
○ NT-3 growth factor receptor Y709+Y710 phosphosite-specific antibody AB-PK840
○ NT-3 growth factor receptor (S706-F713, human) pY709+pY710 phosphopeptide - Powder PE-04AHW95
 

Post-translation Modifications

For detailed information on phosphorylation of this kinase go to PhosphoNET
N-GlcNAcylated:
N72, N79, N133, N163, N203, N218, N232, N259, N267, N272, N294, N375, N388.
Serine phosphorylated:

S701, S706.
Threonine phosphorylated:

T220, T386.
Tyrosine phosphorylated:

Y131, Y516+, Y558, Y705+, Y709+, Y710+, Y800, Y834.
 

Distribution

Based on gene microarray analysis from the NCBI
Human Tissue Distribution
% Max Expression:

Mean Expression:

Number of Samples:

Standard Deviation:
% Max Expression:

Mean Expression:

Number of Samples:

Standard Deviation:
  • adipose
    100

    1060

    106

    1223

  • adrenal
    7

    76

    52

    88

  • bladder
    7

    72

    23

    72

  • brain
    45

    479

    335

    559

  • breast
    43

    461

    99

    350

  • cervix
    2

    21

    277

    19

  • colon
    18

    196

    130

    441

  • heart
    52

    546

    112

    633

  • intestine
    26

    280

    55

    178

  • kidney
    9

    96

    311

    119

  • liver
    7

    76

    90

    94

  • lung
    60

    641

    586

    614

  • lymphnode
    5

    50

    101

    70

  • ovary
    8

    81

    39

    73

  • pancreas
    9

    99

    54

    168

  • pituitary
    3

    32

    63

    29

  • prostate
    4

    40

    529

    61

  • salivarygland
    8

    85

    50

    94

  • skeletalmuscle"
    7

    78

    309

    65

  • skin
    29

    306

    428

    304

  • spinalcord
    18

    186

    66

    294

  • spleen
    6

    67

    76

    115

  • stomach
    4

    45

    47

    58

  • testis
    9

    95

    54

    109

  • thymus
    7

    69

    63

    108

  • thyroid
    50

    532

    195

    582

  • tonsil
    5

    50

    103

    51

  • trachea
    9

    93

    51

    112

  • uterus
    8

    84

    52

    80

  • reticulocytes"
    40

    422

    112

    412

  • t-lymphocytes
    22

    228

    66

    290

  • b-lymphocytes
    69

    736

    121

    1272

  • neutrophils
    6

    61

    170

    273

  • macrophages
    73

    777

    244

    705

  • sperm
    25

    264

    126

    204


Evolution

Species Conservation
PhosphoNET % Identity:
PhosphoNET % Similarity:
Homologene %
Identity:
PhosphoNET % Identity:
PhosphoNET % Similarity:
Homologene %
Identity:
  • tableheader
    100

    100

    100
  • tableheader
    98.1

    98.2

    100
  • tableheader
    99.4

    99.9

    99
  • tableheader
    -

    -

    99
  • tableheader
    -

    -

    96
  • tableheader
    88

    89.5

    98
  • tableheader
    -

    -

    -
  • tableheader
    95.7

    97.4

    97
  • tableheader
    94.6

    96.2

    97
  • tableheader
    -

    -

    -
  • tableheader
    65.2

    74.1

    -
  • tableheader
    88.7

    93.8

    89
  • tableheader
    56.5

    70.1

    85
  • tableheader
    64.5

    71.4

    76
  • tableheader
    -

    -

    -
  • tableheader
    26.2

    43.6

    -
  • tableheader
    -

    -

    -
  • tableheader
    -

    -

    -
  • tableheader
    -

    -

    -
  • tableheader
    -

    -

    -
  • tableheader
    -

    -

    -
  • tableheader
    -

    -

    -
  • tableheader
    -

    -

    -
  • tableheader
    -

    -

    -
  • tableheader
    -

    -

    -
For a wider analysis go to PhosphoNET Evolution in PhosphoNET
 

Binding Proteins

Examples of known interacting proteins
hiddentext
No. Name – UniProt ID
1 NGFR - P08138
2 DOK5 - Q9P104
3 MAPK1 - P28482
4 SHC2 - P98077
5 MAPK3 - P27361
6 DYNLL1 - P63167
7 KIDINS220 - Q9ULH0
8 FRS2 - Q8WU20
9 BDNF - P23560
 

Regulation

Activation:
Phosphorylation of Tyr-516 increases phosphotransferase activity. Phosphorylation of Tyr-834 induces interaction with PLCg1 and Shc1.
Inhibition:
NA
Synthesis:
NA
Degradation:
NA
 

Kinections Map

Click here to download a PPT of the image below
 
Kinections GIF
 

Protein Kinase Specificity

Matrix of observed frequency (%) of amino acids in aligned protein substrate phosphosites

Kinections GIF
Matrix Type:
Predicted from the application of the Kinexus Kinase Substrate Predictor Version 2.0 algorithm, which was trained with over 10,000 kinase-protein substrate pairs and 8,000 kinase-peptide substrate pairs.
Domain #:
1
 

Inhibitors

For further details on these inhibitors click on the Compound Name and enter it into DrugKiNET or click on the ID's
Based on in vitro and/or in vivo phosphorylation data
Compound Name KD, Ki or IC50 (nM) PubChem ID ChEMBL ID PubMed ID
Foretinib Kd = 3.4 nM 42642645 1230609 22037378
Hesperadin Kd < 10 nM 10142586 514409 19035792
Ponatinib IC50 = 13.2 nM 24826799 20513156
Lestaurtinib Kd = 14 nM 126565 22037378
Staurosporine Kd = 17 nM 5279 18183025
Aloisine A IC50 < 25 nM 5326843 75680 22037377
Cdk1/2 Inhibitor III IC50 < 25 nM 5330812 261720 22037377
Gö6976 IC50 < 25 nM 3501 302449 22037377
GSK-3 Inhibitor XIII IC50 < 25 nM 6419766 359482 22037377
IDR E804 IC50 < 25 nM 6419764 1802727 22037377
Indirubin-3′-monoxime IC50 < 25 nM 5326739 22037377
JAK3 Inhibitor VI IC50 < 25 nM 16760524 22037377
K-252a; Nocardiopsis sp. IC50 < 25 nM 3813 281948 22037377
N-Benzoylstaurosporine IC50 < 25 nM 56603681 608533 22037377
SB218078 IC50 < 25 nM 447446 289422 22037377
SU11652 IC50 < 25 nM 24906267 13485 22037377
SU6656 IC50 < 25 nM 5353978 605003 22037377
Sunitinib IC50 < 25 nM 5329102 535 22037377
Syk Inhibitor IC50 < 25 nM 6419747 104279 22037377
2hiw EC50 = 30 nM 10062694 18077425
Nintedanib Kd = 32 nM 9809715 502835 22037378
AST-487 Kd = 34 nM 11409972 574738 18183025
BCP9000906 IC50 > 50 nM 5494425 21156 22037377
BML-275 IC50 > 50 nM 11524144 478629 22037377
Flt-3 Inhibitor II IC50 > 50 nM 11601743 377193 22037377
GSK-3 Inhibitor IX IC50 > 50 nM 5287844 409450 22037377
PKR Inhibitor IC50 > 50 nM 6490494 235641 22037377
Semaxinib IC50 > 50 nM 5329098 276711 22037377
SU11274 IC50 > 50 nM 9549297 261641 22037377
SU9516 IC50 > 50 nM 5289419 258805 22037377
Tozasertib Kd < 50 nM 5494449 572878 19035792
VEGFR2 Kinase Inhibitor II IC50 > 50 nM 5329155 88606 22037377
Crizotinib Kd = 82 nM 11626560 601719 22037378
GW2580 Kd = 120 nM 11617559 261849 18183025
1;9-Pyrazoloanthrone IC50 > 150 nM 8515 7064 22037377
AG-E-60384 IC50 > 150 nM 6419741 413188 22037377
ALX-270-403-M001 IC50 > 150 nM 22037377
Bisindolylmaleimide I IC50 > 150 nM 2396 7463 22037377
Bosutinib IC50 > 150 nM 5328940 288441 22037377
CGP74514A IC50 > 150 nM 2794188 367625 22037377
Flt-3 Inhibitor III IC50 > 150 nM 11772958 22037377
GSK-3 Inhibitor X IC50 > 150 nM 6538818 430226 22037377
IKK-2 Inhibitor IV IC50 > 150 nM 9903786 257167 22037377
IRAK-1-4 Inhibitor I IC50 > 150 nM 11983295 379787 22037377
Purvalanol A IC50 > 150 nM 456214 23327 22037377
VEGFR2 Kinase Inhibitor I IC50 > 150 nM 6419834 86943 22037377
Doramapimod Kd = 190 nM 156422 103667 18183025
Dovitinib Kd = 190 nM 57336746 18183025
Linifanib Kd = 210 nM 11485656 223360 18183025
SU14813 Kd = 220 nM 10138259 1721885 18183025
Compound 52 IC50 > 250 nM 2856 22037377
GTP-14564 IC50 > 250 nM 3385203 406375 22037377
JNJ-7706621 IC50 > 250 nM 5330790 191003 22037377
KW2449 Kd = 250 nM 11427553 1908397 22037378
NU6140 IC50 > 250 nM 10202471 1802728 22037377
PKCb Inhibitor IC50 > 250 nM 6419755 366266 22037377
SU4312 IC50 > 250 nM 6450842 328710 22037377
Tandutinib IC50 > 250 nM 3038522 124660 22037377
Ruxolitinib Kd = 330 nM 25126798 1789941 22037378
Alisertib IC50 < 500 nM 24771867 22016509
Gö6983 IC50 = 500 nM 3499 261491 22037377
PKR Inhibitor; Negative Control IC50 = 500 nM 16760619 22037377
VEGFR2 Kinase Inhibitor IV IC50 = 500 nM 5329468 92461 22037377
Quizartinib Kd = 550 nM 24889392 576982 19654408
Nilotinib Kd = 600 nM 644241 255863 22037378
Sorafenib Kd = 600 nM 216239 1336 18183025
PHA-665752 Kd = 930 nM 10461815 450786 22037378
AGL2043 IC50 > 1 µM 9817165 22037377
Alsterpaullone IC50 > 1 µM 5005498 50894 22037377
Alsterpaullone; 2-Cyanoethyl IC50 > 1 µM 16760286 260138 22037377
Dasatinib IC50 > 1 µM 11153014 1421 22037377
Lck Inhibitor IC50 > 1 µM 6603792 22037377
ST078197 IC50 > 1 µM 1048845 210833 22037377
STO609 IC50 > 1 µM 51371511 22037377
Syk Inhibitor II IC50 > 1 µM 16760670 22037377
TWS119 IC50 > 1 µM 9549289 405759 22037377
WZ3146 Kd > 1 µM 44607360 20033049
WZ4002 Kd > 1 µM 44607530 20033049
AC1NS4N8 Kd < 2.5 µM 23649240 19035792
 

Disease Linkage

General Disease Association:

Cancer
Specific Cancer Types:
Fibrosarcomas; medulloblastoma; Congenital mesoblastic nephromas (CMN); Mesoblastic nephromas; Congenital fibrosarcomas (CFS); Gastrointestinal stromal tumours (GIST); Polymorphous low-grade adenocarcinomas (PLGA); Medulloblastomas, desmoplastic
Gene Expression in Cancers:

TranscriptoNET (www.transcriptonet.ca) analysis with mRNA expression data retrieved from the National Center for Biotechnology Information's Gene Expression Omnibus (GEO) database, which was normalized against 60 abundantly and commonly found proteins, indicated altered expression for this protein kinase as shown here as the percent change from normal tissue controls (%CFC) as supported with the Student T-test in the following types of human cancers: Bladder carcinomas (%CFC= -62, p<0.0001); Breast epithelial hyperplastic enlarged lobular units (HELU) (%CFC= -46, p<0.076); Clear cell renal cell carcinomas (cRCC) stage I (%CFC= +253, p<0.0002); Malignant pleural mesotheliomas (MPM) tumours (%CFC= -47, p<0.0005); Pituitary adenomas (ACTH-secreting) (%CFC= -65, p<0.018); Skin fibrosarcomas (%CFC= +270, p<0.0002); and Skin melanomas - malignant (%CFC= +1652, p<0.0001). The COSMIC website notes an up-regulated expression score for TRKC in diverse human cancers of 302, which is 0.7-fold of the average score of 462 for the human protein kinases. The down-regulated expression score of 14 for this protein kinase in human cancers was 0.2-fold of the average score of 60 for the human protein kinases.
Mutagenesis Experiments:

Insertional mutagenesis studies in mice have not yet revealed a role for this protein kinase in mouse cancer oncogenesis.
Mutation Rate in All Cancers:

Percent mutation rates per 100 amino acids length in human cancers: 0.17 % in 27504 diverse cancer specimens. This rate is 2.3-fold higher than the average rate of 0.075 % calculated for human protein kinases in general.
Mutation Rate in Specific Cancers:

Highest percent mutation rates per 100 amino acids length in human cancers: 0.97 % in 809 skin cancers tested; 0.63 % in 1374 large intestine cancers tested; 0.41 % in 2581 lung cancers tested; 0.3 % in 602 endometrium cancers tested; 0.29 % in 816 stomach cancers tested; 0.24 % in 605 oesophagus cancers tested; 0.11 % in 1278 liver cancers tested; 0.09 % in 1396 kidney cancers tested.
Frequency of Mutated Sites:

None > 8 in 22,538 cancer specimens
Comments:
Only 8 deletions, no insertions and no complex mutations are noted on the COSMIC website.
 
COSMIC Entry:
NTRK3
OMIM Entry:
191316
  • Home
  • Top of Page
Copyright 2019 Kinexus BioInformatics Corporation