
Nomenclature
Short Name:
AAK1
Full Name:
AP2-associated protein kinase 1
Alias:
- KIAA1048 protein, Adaptor-associated kinase 1
- Kinase AAK1
- AP2 associated kinase 1
- DKFZp686K16132
- EC 2.7.11.1
- KIAA1048
Classification
Type:
Protein-serine/threonine kinase
Group:
Other
Family:
NAK
SubFamily:
NA

Structure
Mol. Mass (Da):
93,578
# Amino Acids:
863
# mRNA Isoforms:
2
mRNA Isoforms:
103,885 Da (961 AA; Q2M2I8); 93,578 Da (863 AA; Q2M2I8-2)
4D Structure:
Interacts with alpha-adaptin and AP-2
1D Structure:
3D Image (rendered using PV Viewer):
PDB ID
Subfamily Alignment
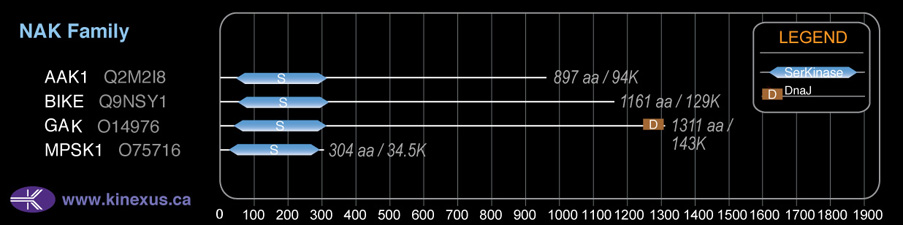
Domain Distribution:
| Start | End | Domain |
|---|---|---|
| 46 | 315 | Pkinase |
Kinexus Products
Click on entries below for direct links to relevant products from Kinexus for this protein kinase.
hiddentext
Post-translation Modifications
For detailed information on phosphorylation of this kinase go to PhosphoNET
Acetylated:
M1.
Serine phosphorylated:
S14, S18, S20, S21, S235, S327, S618, S623, S624, S637, S642, S650, S652, S668, S670, S676, S678, S682, S690, S731, S797, S846, S937, S938.
Threonine phosphorylated:
T347, T354, T359, T362, T389, T441, T606, T620, T627, T640, T653, T674, T848, T852.
Tyrosine phosphorylated:
Y34, Y234, Y253, Y292, Y687.
Distribution
Based on gene microarray analysis from the NCBI
Human Tissue Distribution
% Max Expression:
Mean Expression:
Number of Samples:
Standard Deviation:
% Max Expression:
Mean Expression:
Number of Samples:
Standard Deviation:
 93
93
914
85
1060
 8
8
82
34
117
 32
32
313
20
287
 47
47
469
301
588
 67
67
661
69
543
 7
7
67
217
156
 25
25
243
100
428
 85
85
838
110
1472
 39
39
382
35
261
 21
21
210
279
452
 8
8
75
76
108
 60
60
593
463
605
 16
16
160
75
321
 6
6
59
24
68
 16
16
163
64
281
 8
8
79
50
131
 17
17
169
711
1630
 18
18
180
37
237
 8
8
79
251
110
 44
44
431
321
504
 14
14
136
59
199
 16
16
158
68
281
 38
38
377
25
458
 19
19
187
37
295
 22
22
218
60
352
 100
100
988
173
1377
 11
11
105
75
197
 12
12
118
39
140
 20
20
195
38
263
 18
18
182
98
220
 33
33
324
42
366
 86
86
847
91
1595
 27
27
263
193
628
 91
91
901
182
750
 28
28
274
100
405
Evolution
Species Conservation
PhosphoNET % Identity:
PhosphoNET % Similarity:
Homologene %
Identity:
PhosphoNET % Identity:
PhosphoNET % Similarity:
Homologene %
Identity:
 100
100
100
100 99.4
99.4
99.6
99.5 -
-
-
- -
-
-
- -
-
-
- 53.7
53.7
54.4
92 -
-
-
- 80.7
80.7
83.1
91 79.9
79.9
82.7
90 -
-
-
- -
-
-
- 71.4
71.4
77.9
81 -
-
-
- -
-
-
- -
-
-
- -
-
-
- 36.7
36.7
50
- -
-
-
- -
-
-
- -
-
-
- -
-
-
- -
-
-
- -
-
-
- 22
22
38.2
- -
-
-
-
For a wider analysis go to PhosphoNET Evolution in PhosphoNET
Regulation
Activation:
Stimulated by clathrin.
Inhibition:
NA
Synthesis:
NA
Degradation:
NA
Known Upstream Kinases
For further details on these substrates click on the Substrate Short Name or UniProt ID. Phosphosite Location is hyperlinked to PhosphoNET
predictions.
Based on in vitro and/or in vivo phosphorylation data
| Kinase Short Name | UniProt ID (Human) | Phosphosite Location | Phosphosite Sequence | Effect of Phosphorylation |
|---|
Known Downstream Substrates
For further details on these substrates click on the Substrate Short Name or UniProt ID. Phosphosite Location is hyperlinked to PhosphoNET
predictions.
Based on in vitro and/or in vivo phosphorylation data
| Substrate Short Name | UniProt ID (Human) | Phosphosite Location | Phosphosite Sequence | Effect of Phosphorylation |
|---|
Protein Kinase Specificity
Matrix of observed frequency (%) of amino acids in aligned protein substrate phosphosites
Matrix Type:
Predicted from the application of the Kinexus Kinase Substrate Predictor Version 2.0 algorithm, which was trained with over 10,000 kinase-protein substrate pairs and 8,000 kinase-peptide substrate pairs.
Domain #:
1
Inhibitors
For further details on these inhibitors click on the Compound Name and enter it into DrugKiNET or click on the ID's
Based on in vitro and/or in vivo phosphorylation data
| Compound Name | KD, Ki or IC50 (nM) | PubChem ID | ChEMBL ID | PubMed ID |
|---|
Disease Linkage
Gene Expression in Cancers:
TranscriptoNET (www.transcriptonet.ca) analysis with mRNA expression data retrieved from the National Center for Biotechnology Information's Gene Expression Omnibus (GEO) database, which was normalized against 60 abundantly and commonly found proteins, indicated altered expression for this protein kinase as shown here as the percent change from normal tissue controls (%CFC) as supported with the Student T-test in the following types of human cancers: Brain glioblastomas (%CFC= +131, p<0.052); Classical Hodgkin lymphomas (%CFC= +64, p<0.002); Classical Hodgkin lymphomas (%CFC= +57, p<0.006); Clear cell renal cell carcinomas (cRCC) stage I (%CFC= +509, p<0.032); Colon mucosal cell adenomas (%CFC= -50, p<0.0001); and Prostate cancer - primary (%CFC= +134, p<0.0001). The COSMIC website notes an up-regulated expression score for AAK1 in diverse human cancers of 437, which is close to the average score of 462 for the human protein kinases. The down-regulated expression score of 60 for this protein kinase in human cancers was 1-fold of the average score of 60 for the human protein kinases.
Mutagenesis Experiments:
Insertional mutagenesis studies in mice support a role for this protein kinase in mouse cancer oncogenesis.
Mutation Rate in All Cancers:
Percent mutation rates per 100 amino acids length in human cancers: 0.05 % in 24726 diverse cancer specimens. This rate is only -35 % lower than the average rate of 0.075 % calculated for human protein kinases in general.
Mutation Rate in Specific Cancers:
Highest percent mutation rates per 100 amino acids length in human cancers: 0.23 % in 603 endometrium cancers tested; 0.21 % in 273 cervix cancers tested; 0.18 % in 1270 large intestine cancers tested; 0.16 % in 864 skin cancers tested; 0.14 % in 589 stomach cancers tested; 0.1 % in 710 oesophagus cancers tested; 0.09 % in 127 biliary tract cancers tested; 0.07 % in 1634 lung cancers tested; 0.06 % in 1316 breast cancers tested; 0.05 % in 238 bone cancers tested; 0.05 % in 1512 liver cancers tested; 0.03 % in 441 autonomic ganglia cancers tested; 0.03 % in 382 soft tissue cancers tested; 0.03 % in 1276 kidney cancers tested; 0.02 % in 958 upper aerodigestive tract cancers tested; 0.02 % in 548 urinary tract cancers tested; 0.02 % in 1459 pancreas cancers tested; 0.01 % in 881 prostate cancers tested; 0.01 % in 833 ovary cancers tested; 0.01 % in 2082 central nervous system cancers tested; 0.01 % in 2009 haematopoietic and lymphoid cancers tested.
Frequency of Mutated Sites:
Most frequent mutations with the number of reports indicated in brackets: R141H (4).
Comments:
Only 5 deletions, 1 insertion, and no complex mutations are noted on the COSMIC website.