
Nomenclature
Short Name:
BRDT
Full Name:
Bromo domain testes-specific protein
Alias:
- BRD6
- Bromodomain, testis-specific
- Cancer,testis antigen 9
- Cancer/testis antigen 9
- CT9
- RING3-like protein
Classification
Type:
Protein-serine/threonine kinase
Group:
Atypical
Family:
BRD
SubFamily:
NA

Structure
Mol. Mass (Da):
107,954
# Amino Acids:
947
# mRNA Isoforms:
5
mRNA Isoforms:
109,506 Da (960 AA; Q58F21-2); 108,268 Da (951 AA; Q58F21-3); 107,954 Da (947 AA; Q58F21); 102,361 Da (901 AA; Q58F21-4); 99,394 Da (874 AA; Q58F21-5)
4D Structure:
Interacts with histone H4 acetylated N-terminus
1D Structure:
3D Image (rendered using PV Viewer):
PDB ID
Subfamily Alignment
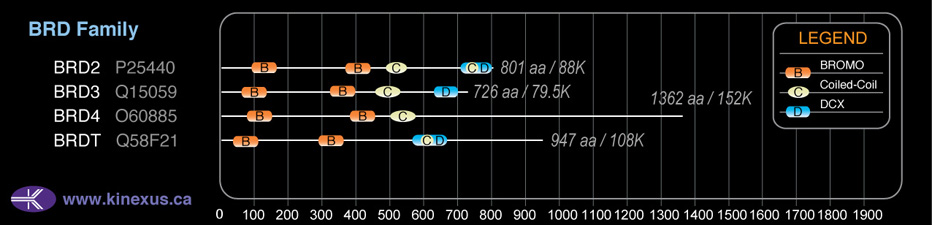
Domain Distribution:
| Start | End | Domain |
|---|---|---|
| 44 | 116 | BROMO |
| 287 | 359 | BROMO |
| 567 | 658 | DUF755 |
| 588 | 621 | Coiled-coil |
Post-translation Modifications
For detailed information on phosphorylation of this kinase go to PhosphoNET
Acetylated:
K483, K820, K855.
Serine phosphorylated:
S187, S196, S199, S201, S277, S545, S547, S572, S638, S640, S642, S643, S644, S645, S658, S659, S667.
Threonine phosphorylated:
T402, T558, T674.
Tyrosine phosphorylated:
Y19, Y291, Y296, Y309, Y310, Y331, Y335.
Distribution
Based on gene microarray analysis from the NCBI
Human Tissue Distribution
% Max Expression:
Mean Expression:
Number of Samples:
Standard Deviation:
% Max Expression:
Mean Expression:
Number of Samples:
Standard Deviation:
 13
13
276
16
858
 0.5
0.5
10
8
13
 0.3
0.3
6
5
6
 24
24
523
60
1230
 12
12
266
14
268
 5
5
113
44
344
 7
7
143
19
280
 71
71
1561
31
2787
 11
11
249
10
259
 1
1
22
42
24
 0.3
0.3
7
21
8
 14
14
296
102
375
 0.4
0.4
8
21
9
 0.3
0.3
7
8
13
 1.2
1.2
26
18
40
 0.3
0.3
6
7
5
 0.3
0.3
6
105
18
 0.5
0.5
11
15
13
 0.8
0.8
18
52
21
 11
11
239
56
273
 0.4
0.4
9
17
13
 0.3
0.3
6
19
6
 0.8
0.8
17
11
17
 100
100
2186
17
3407
 0.3
0.3
6
17
6
 95
95
2079
39
3726
 0.3
0.3
7
19
8
 0.5
0.5
11
16
15
 0.1
0.1
3
15
4
 3
3
57
14
41
 19
19
414
30
214
 61
61
1337
21
2624
 10
10
212
44
572
 24
24
535
26
468
 28
28
615
22
803
Evolution
Species Conservation
PhosphoNET % Identity:
PhosphoNET % Similarity:
Homologene %
Identity:
PhosphoNET % Identity:
PhosphoNET % Similarity:
Homologene %
Identity:
 100
100
100
100 92.6
92.6
93
97 84.7
84.7
89
95 -
-
-
- -
-
-
80 81.9
81.9
87.6
83 -
-
-
- 70.8
70.8
79.3
74 36.3
36.3
52.9
76 -
-
-
- 33.4
33.4
37.9
- 35.3
35.3
49.4
55 -
-
-
54.5 -
-
49
55 -
-
-
- 23.5
23.5
32.3
- -
-
-
- -
-
-
- -
-
-
- -
-
-
- -
-
-
- -
-
-
- -
-
-
- -
-
-
- -
-
-
-
For a wider analysis go to PhosphoNET Evolution in PhosphoNET
Regulation
Activation:
NA
Inhibition:
NA
Synthesis:
NA
Degradation:
NA
Disease Linkage
General Disease Association:
Reproductive disorders
Specific Diseases (Non-cancerous):
Spermatogenesis deficiency
Comments:
No or very low expression of this gene is seen in patients' testes with abnormal spermatogenesis.
Comments:
BRDT is expressed in cancers such as non-small cell lung cancer and squamous cell carcinomas of the head and neck as well as of esophagus, but not in melanomas or in cancers of the colon, breast, kidney and bladder.
Gene Expression in Cancers:
The COSMIC website notes an up-regulated expression score for BRDT in diverse human cancers of 340, which is 0.7-fold of the average score of 462 for the human protein kinases. The down-regulated expression score of 0 for this protein kinase in human cancers was 100% lower than the average score of 60 for the human protein kinases.
Mutagenesis Experiments:
Insertional mutagenesis studies in mice have not yet revealed a role for this protein kinase in mouse cancer oncogenesis.
Mutation Rate in All Cancers:
Percent mutation rates per 100 amino acids length in human cancers: 0.09 % in 24766 diverse cancer specimens. This rate is only 14 % higher than the average rate of 0.075 % calculated for human protein kinases in general.
Mutation Rate in Specific Cancers:
Highest percent mutation rates per 100 amino acids length in human cancers: 0.53 % in 864 skin cancers tested; 0.28 % in 603 endometrium cancers tested; 0.25 % in 1270 large intestine cancers tested; 0.24 % in 629 stomach cancers tested; 0.19 % in 1634 lung cancers tested; 0.15 % in 710 oesophagus cancers tested; 0.11 % in 881 prostate cancers tested; 0.06 % in 1512 liver cancers tested.
Frequency of Mutated Sites:
Most frequent mutations with the number of reports indicated in brackets: T371M (6).
Comments:
No deletions, insertions or complex mutations are noted on the COSMIC website.