
Nomenclature
Short Name:
KSR2
Full Name:
Kinase suppressor of ras-2
Alias:
- FLJ25965
- AC026678_EPK
Classification
Type:
Protein-serine/threonine kinase
Group:
TKL
Family:
RAF
SubFamily:
NA

Structure
Mol. Mass (Da):
107632
# Amino Acids:
950
# mRNA Isoforms:
2
mRNA Isoforms:
107,632 Da (950 AA; Q6VAB6); 49,607 Da (439 AA; Q6VAB6-2)
4D Structure:
Interacts with MAP2K1, MAP3K8, MAPK, RAS and RAF.
1D Structure:
Subfamily Alignment
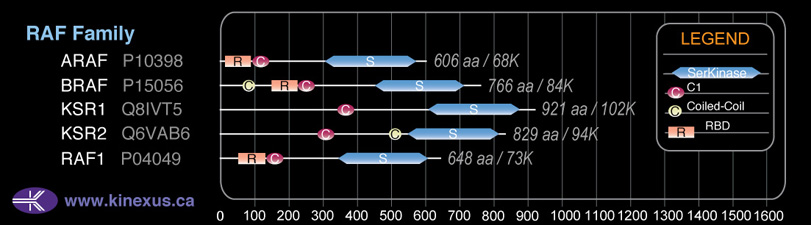
Domain Distribution:
| Start | End | Domain |
|---|---|---|
| 292 | 339 | C1 |
| 497 | 517 | Coiled-coil |
| 666 | 943 | Pkinase |
Kinexus Products
Click on entries below for direct links to relevant products from Kinexus for this protein kinase.
hiddentext
Post-translation Modifications
For detailed information on phosphorylation of this kinase go to PhosphoNET
Serine phosphorylated:
S34, S294, S311, S394, S399, S474, S490, S939.
Threonine phosphorylated:
T260, T264, T269, T270, T272, T276, T290, T306, T497.
Tyrosine phosphorylated:
Y566.
Distribution
Based on gene microarray analysis from the NCBI
Human Tissue Distribution
% Max Expression:
Mean Expression:
Number of Samples:
Standard Deviation:
% Max Expression:
Mean Expression:
Number of Samples:
Standard Deviation:
 70
70
1932
12
1350
 0.4
0.4
11
8
11
 -
-
-
-
-
 6
6
177
58
222
 12
12
324
23
244
 0.4
0.4
10
18
5
 0.4
0.4
10
26
6
 1.3
1.3
36
8
52
 0.2
0.2
6
6
4
 2
2
66
32
42
 0.7
0.7
20
8
27
 22
22
603
20
481
 -
-
-
-
-
 0.3
0.3
7
6
4
 8
8
208
8
223
 0.4
0.4
12
10
5
 2
2
63
75
44
 0.4
0.4
10
6
4
 2
2
65
24
37
 11
11
316
57
179
 3
3
96
8
166
 0.8
0.8
21
8
31
 -
-
-
-
-
 0.2
0.2
5
6
3
 1.4
1.4
39
8
63
 21
21
591
38
539
 0.2
0.2
6
6
5
 0.2
0.2
6
6
4
 0.3
0.3
8
6
5
 6
6
164
14
62
 26
26
706
12
66
 100
100
2762
22
5584
 0.1
0.1
2
24
1
 26
26
706
52
643
 4
4
111
35
148
Evolution
Species Conservation
PhosphoNET % Identity:
PhosphoNET % Similarity:
Homologene %
Identity:
PhosphoNET % Identity:
PhosphoNET % Similarity:
Homologene %
Identity:
 100
100
100
100 91.1
91.1
92.1
100 84.3
84.3
84.5
99 -
-
-
99 -
-
-
- 51
51
64.6
99 -
-
-
- 95.5
95.5
97
96 -
-
-
97 -
-
-
- 25.1
25.1
26.3
- 24.3
24.3
40.2
- -
-
-
90 82.3
82.3
90.1
83 -
-
-
- 24.9
24.9
40.9
- 36.4
36.4
53.5
- -
-
-
- -
-
-
- -
-
-
- -
-
-
- -
-
-
- 21.4
21.4
38.2
- -
-
-
- -
-
-
-
For a wider analysis go to PhosphoNET Evolution in PhosphoNET
Binding Proteins
Examples of known interacting proteins
hiddentext
| No. | Name – UniProt ID |
|---|---|
| 1 | RAF1 - P04049 |
| 2 | MAPK1 - P28482 |
| 3 | MAPKSP1 - Q9UHA4 |
| 4 | MAPK3 - P27361 |
| 5 | MAP2K1 - Q02750 |
Regulation
Activation:
NA
Inhibition:
NA
Synthesis:
NA
Degradation:
NA
Protein Kinase Specificity
Matrix of observed frequency (%) of amino acids in aligned protein substrate phosphosites
Matrix Type:
Predicted from the application of the Kinexus Kinase Substrate Predictor Version 2.0 algorithm, which was trained with over 10,000 kinase-protein substrate pairs and 8,000 kinase-peptide substrate pairs.
Domain #:
1
Disease Linkage
General Disease Association:
Endocrine disorders
Specific Diseases (Non-cancerous):
Obesity; Insulin resistance
Comments:
Mutations in KSR2 have been observed in patients with severe early-onset obesity. Affected individuals display hyperphagia, low heart rate, reduced basal metabolic rate, and insulin resistance. These mutations disrupted the Raf-MEK-ERK signalling pathway and lead to defects in fatty acid and glucose oxidation in the affected cells. Treatment with the anti-diabetic drug metformin increased fuel oxidation and rescued the cellular phenotype. In animal studies, mice lacking the KSR2 gene display severe obesity and insulin resistance, potentially reflecting a role for the protein in the maintenance of energy homeostasis.
Gene Expression in Cancers:
TranscriptoNET (www.transcriptonet.ca) analysis with mRNA expression data retrieved from the National Center for Biotechnology Information's Gene Expression Omnibus (GEO) database, which was normalized against 60 abundantly and commonly found proteins, indicated altered expression for this protein kinase as shown here as the percent change from normal tissue controls (%CFC) as supported with the Student T-test in human Ovary adenocarcinomas (%CFC= +107, p<0.004). The COSMIC website notes an up-regulated expression score for KSR2 in diverse human cancers of 397, which is 0.9-fold of the average score of 462 for the human protein kinases. The down-regulated expression score of 0 for this protein kinase in human cancers was 100% lower than the average score of 60 for the human protein kinases.
Mutagenesis Experiments:
Insertional mutagenesis studies in mice have not yet revealed a role for this protein kinase in mouse cancer oncogenesis.
Mutation Rate in All Cancers:
Percent mutation rates per 100 amino acids length in human cancers: 0.14 % in 25426 diverse cancer specimens. This rate is 1.9-fold higher than the average rate of 0.075 % calculated for human protein kinases in general.
Mutation Rate in Specific Cancers:
Highest percent mutation rates per 100 amino acids length in human cancers: 1.05 % in 10 peritoneum cancers tested; 1 % in 864 skin cancers tested; 0.5 % in 1294 large intestine cancers tested; 0.48 % in 589 stomach cancers tested; 0.35 % in 603 endometrium cancers tested; 0.24 % in 710 oesophagus cancers tested; 0.21 % in 968 upper aerodigestive tract cancers tested; 0.15 % in 273 cervix cancers tested; 0.15 % in 1956 lung cancers tested; 0.11 % in 1467 pancreas cancers tested; 0.09 % in 939 prostate cancers tested; 0.09 % in 2082 central nervous system cancers tested; 0.08 % in 1512 liver cancers tested; 0.08 % in 1511 breast cancers tested; 0.08 % in 127 biliary tract cancers tested; 0.06 % in 558 thyroid cancers tested; 0.06 % in 548 urinary tract cancers tested; 0.05 % in 1276 kidney cancers tested; 0.04 % in 891 ovary cancers tested; 0.04 % in 2009 haematopoietic and lymphoid cancers tested.
Frequency of Mutated Sites:
Most frequent mutations with the number of reports indicated in brackets: Y264S (9); E87K (4).
Comments:
Ten deletions (6 L568fs*61) and 1 insertion, and no complex mutations are noted on the COSMIC website.