
Nomenclature
Short Name:
SgK496
Full Name:
Receptor interacting protein kinase 5, isoform 1
Alias:
- DSTYK
- Dusty PK
- Receptor-interacting serine/threonine-protein kinase 5
- RIP5
- RIP-homologous kinase
- RIPK5; SGK496
- Dusty protein kinase
- EC 2.7.11.1
- HDCMD38P
- KIAA0472
Classification
Type:
Protein-serine/threonine kinase
Group:
Other
Family:
Other-Unique
SubFamily:
NA

Structure
Mol. Mass (Da):
105,206
# Amino Acids:
929
# mRNA Isoforms:
4
mRNA Isoforms:
105,206 Da (929 AA; Q6XUX3); 99,968 Da (884 AA; Q6XUX3-2); 66,302 Da (587 AA; Q6XUX3-3); 20,769 Da (179 AA; Q6XUX3-4)
4D Structure:
NA
1D Structure:
Subfamily Alignment

Domain Distribution:
| Start | End | Domain |
|---|---|---|
| 395 | 415 | Coiled-coil |
| 652 | 906 | Pkinase |
Post-translation Modifications
For detailed information on phosphorylation of this kinase go to PhosphoNET
Acetylated:
K824.
Methylated:
R29.
Serine phosphorylated:
S286, S575, S577, S579, S928.
Distribution
Based on gene microarray analysis from the NCBI
Human Tissue Distribution
% Max Expression:
Mean Expression:
Number of Samples:
Standard Deviation:
% Max Expression:
Mean Expression:
Number of Samples:
Standard Deviation:
 95
95
1053
51
1298
 8
8
87
21
73
 4
4
44
3
29
 29
29
316
148
410
 63
63
695
46
557
 3
3
31
120
29
 9
9
98
53
252
 100
100
1104
46
1878
 36
36
393
24
296
 7
7
82
127
70
 4
4
39
30
30
 58
58
645
219
556
 3
3
36
36
20
 6
6
67
15
77
 7
7
77
21
78
 6
6
70
27
55
 7
7
81
184
83
 4
4
48
13
31
 6
6
68
129
43
 54
54
597
190
589
 13
13
145
18
145
 8
8
89
24
99
 3
3
35
6
25
 6
6
68
14
59
 9
9
97
18
131
 64
64
705
89
732
 4
4
41
39
27
 6
6
65
14
38
 6
6
67
14
58
 12
12
130
56
104
 70
70
773
42
660
 72
72
798
56
1327
 6
6
62
88
215
 67
67
740
104
641
 7
7
74
70
86
Evolution
Species Conservation
PhosphoNET % Identity:
PhosphoNET % Similarity:
Homologene %
Identity:
PhosphoNET % Identity:
PhosphoNET % Similarity:
Homologene %
Identity:
 100
100
100
100 99.4
99.4
99.6
99 96.3
96.3
96.6
99 -
-
-
94 -
-
-
- -
-
-
94 -
-
-
- 91.2
91.2
94.4
91.5 90.9
90.9
93.9
91 -
-
-
- 52.9
52.9
57.9
- 78.3
78.3
87.5
79.5 71.5
71.5
82.4
74 67.2
67.2
79.3
71 67.9
67.9
80.9
- -
-
-
- 37.9
37.9
54.2
- -
-
-
- 42.2
42.2
58.7
- -
-
-
- -
-
-
- -
-
-
- -
-
-
- -
-
-
- -
-
-
-
For a wider analysis go to PhosphoNET Evolution in PhosphoNET
Regulation
Activation:
NA
Inhibition:
NA
Synthesis:
NA
Degradation:
NA
Protein Kinase Specificity
Matrix of observed frequency (%) of amino acids in aligned protein substrate phosphosites
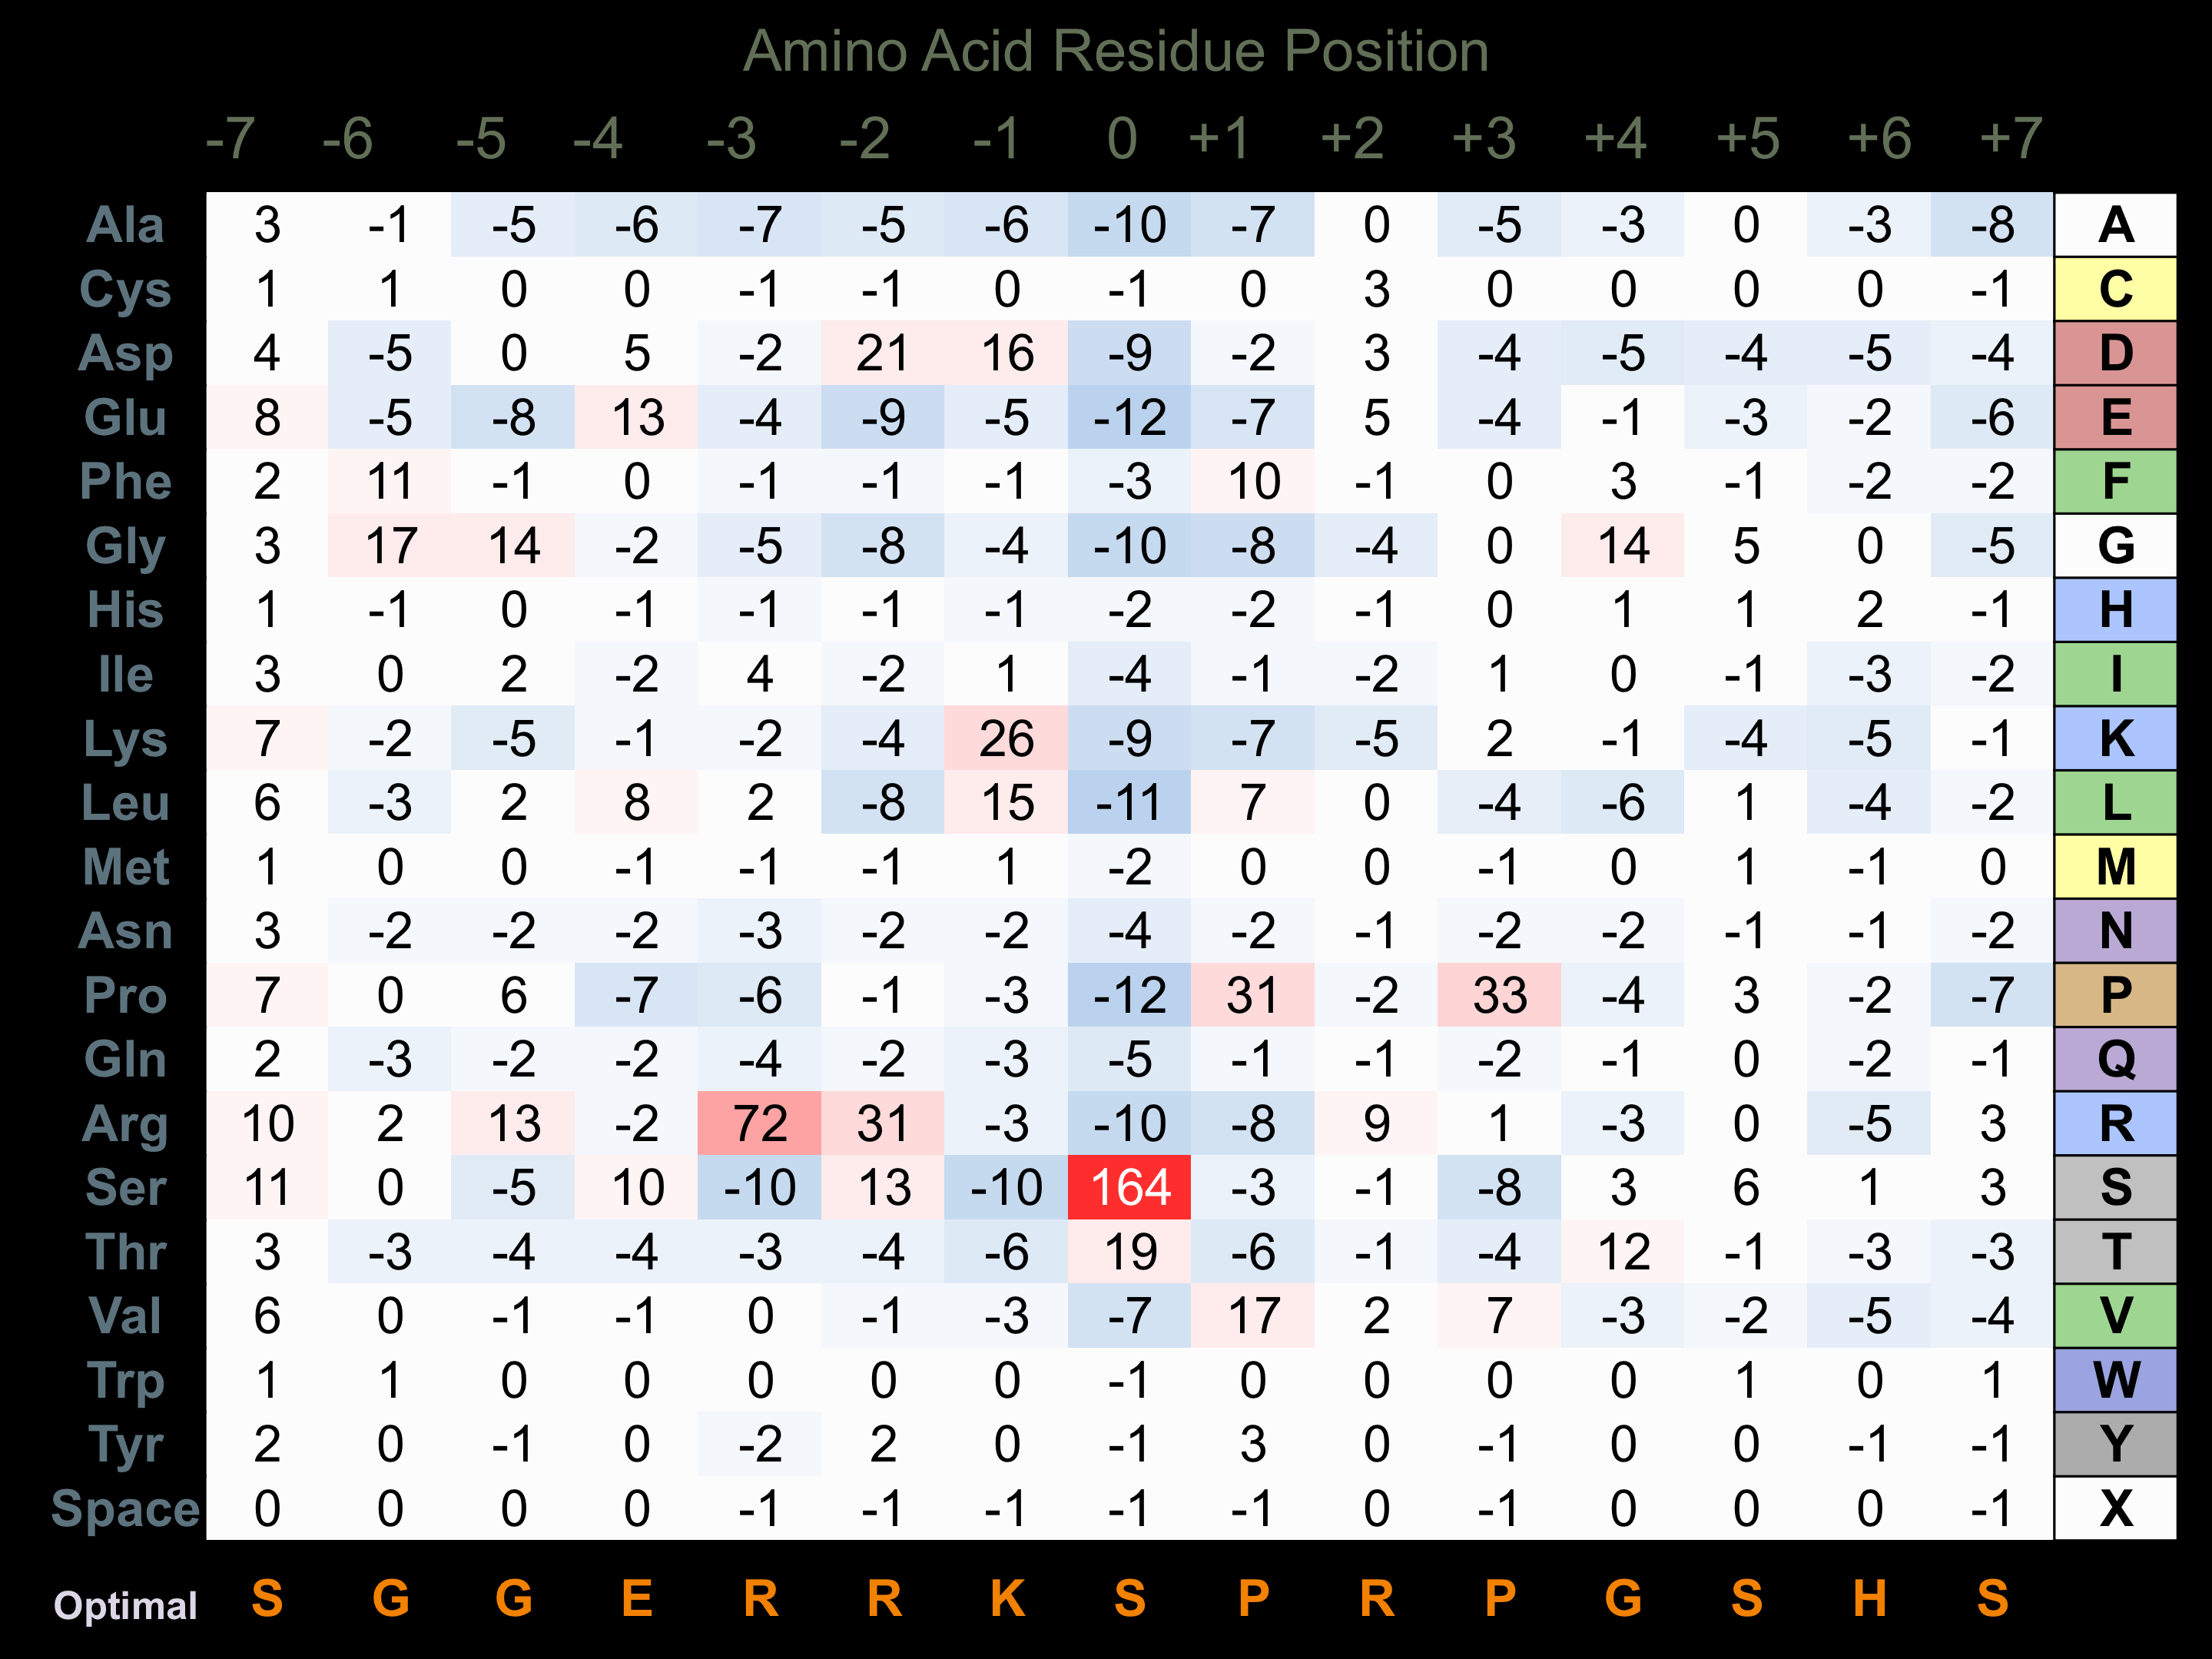
Matrix Type:
Predicted from the application of the Kinexus Kinase Substrate Predictor Version 2.0 algorithm, which was trained with over 10,000 kinase-protein substrate pairs and 8,000 kinase-peptide substrate pairs.
Domain #:
1
Inhibitors
For further details on these inhibitors click on the Compound Name and enter it into DrugKiNET or click on the ID's
Based on in vitro and/or in vivo phosphorylation data
| Compound Name | KD, Ki or IC50 (nM) | PubChem ID | ChEMBL ID | PubMed ID |
|---|
Disease Linkage
General Disease Association:
Nephrological disorders
Specific Diseases (Non-cancerous):
Congenital anomalies of kidney and urinary tract; Unilateral renal agenesis
Comments:
Mutations in SgK496 were found in 2.3% of patients with congenital kidney and urinary tract abnormalities, including a heterozygous nonsense mutation, indicating that a loss-of-function in the protein activity is responsible for the observed abnormalities. In the mouse kidney, SgK496 expression is low in the nephrogenic zone, higher in the maturing tubular epithelia, and highest in the medulla and papilla, indicating a role for the gene in kidney development. Different combinations of FGF ligands and receptors play important roles during development in the ureteric bud, metanephric mesenchyme, and renal stroma. Consistent with this observation, mutations in the SgK496 gene have been observed in patients with ureter and renal parenchyma defects. In animal studies, knockdown of the SgK496 orthologue in zeB-Rafish resulted in retarded growth, small fins, abnormal tail morphology, and heart defects, consistent with the developmental phenotypes observed with global loss of FGF signalling. Unilateral renal agenesis is a disorder characterized by the failure of one of the kidneys to develop and has also been linked to the SgK496 gene. Therefore, loss-of-function of the SgK496 protein is thought to contribute to the observed defects in kidney structure and function, indicating a role for the protein in renal development.
Gene Expression in Cancers:
TranscriptoNET (www.transcriptonet.ca) analysis with mRNA expression data retrieved from the National Center for Biotechnology Information's Gene Expression Omnibus (GEO) database, which was normalized against 60 abundantly and commonly found proteins, indicated altered expression for this protein kinase as shown here as the percent change from normal tissue controls (%CFC) as supported with the Student T-test in the following types of human cancers: Brain glioblastomas (%CFC= +912, p<0.026); Clear cell renal cell carcinomas (cRCC) stage I (%CFC= +256, p<0.009); Prostate cancer - metastatic (%CFC= -48, p<0.0001); Prostate cancer - primary (%CFC= +78, p<0.0001); and Skin melanomas - malignant (%CFC= +148, p<0.0001).
Mutagenesis Experiments:
Insertional mutagenesis studies in mice have not yet revealed a role for this protein kinase in mouse cancer oncogenesis.
Mutation Rate in All Cancers:
Percent mutation rates per 100 amino acids length in human cancers: 0.06 % in 24434 diverse cancer specimens. This rate is only -24 % lower than the average rate of 0.075 % calculated for human protein kinases in general.
Mutation Rate in Specific Cancers:
Highest percent mutation rates per 100 amino acids length in human cancers: 0.16 % in 589 stomach cancers tested; 0.14 % in 864 skin cancers tested; 0.12 % in 1270 large intestine cancers tested; 0.07 % in 603 endometrium cancers tested; 0.07 % in 1634 lung cancers tested; 0.05 % in 238 bone cancers tested.
Frequency of Mutated Sites:
None > 5 in 20,009 cancer specimens
Comments:
Only 3 deletions, 1 insertion, and no complex mutations are noted on the COSMIC website.