
Nomenclature
Short Name:
MAP3K15
Full Name:
Mitogen-activated protein kinase kinase kinase 7
Alias:
- BA723P2.3
- EC 2.7.11.25
- MAPK/ERK kinase kinase 15
- MEK kinase 15
- MEKK 15
- FLJ16518
- M3K15
- MAP3K7
- MAPK,ERK kinase kinase 15
Classification
Type:
Protein-serine/threonine kinase
Group:
STE
Family:
STE11
SubFamily:
NA

Structure
Mol. Mass (Da):
144569
# Amino Acids:
1374
# mRNA Isoforms:
3
mRNA Isoforms:
147,437 Da (1313 AA; Q6ZN16); 89,423 Da (788 AA; Q6ZN16-3); 84,729 Da (748 AA; Q6ZN16-2);
4D Structure:
NA
1D Structure:
Subfamily Alignment
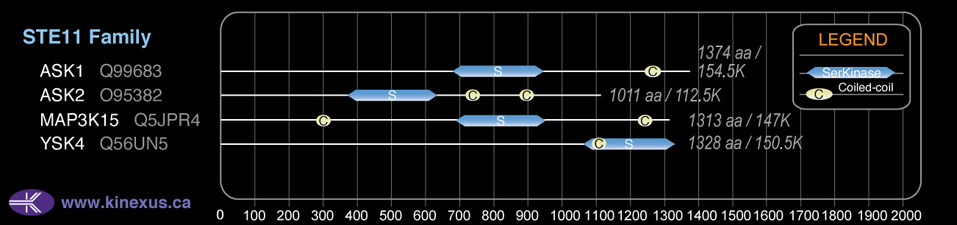
Domain Distribution:
| Start | End | Domain |
|---|---|---|
| 652 | 908 | Pkinase |
| 1179 | 1225 | Coiled-coil |
Post-translation Modifications
For detailed information on phosphorylation of this kinase go to PhosphoNET
Methylated:
K751.
Serine phosphorylated:
S432, S484+, S608, S924-, S994-, S1269.
Threonine phosphorylated:
T609, T808+, T812-.
Tyrosine phosphorylated:
Y298, Y446, Y763, Y1201.
Distribution
Based on gene microarray analysis from the NCBI
Human Tissue Distribution
% Max Expression:
Mean Expression:
Number of Samples:
Standard Deviation:
% Max Expression:
Mean Expression:
Number of Samples:
Standard Deviation:
 35
35
887
6
992
 6
6
158
4
87
 -
-
-
-
-
 0.6
0.6
15
26
8
 15
15
378
12
325
 0.2
0.2
5
9
4
 0.2
0.2
5
13
5
 1.3
1.3
33
3
3
 0.7
0.7
18
3
1
 0.7
0.7
17
27
13
 0.5
0.5
14
3
2
 24
24
612
9
454
 -
-
-
-
-
 1.1
1.1
28
3
2
 0.7
0.7
17
3
14
 0.8
0.8
20
5
7
 0.2
0.2
6
7
4
 1.3
1.3
33
3
3
 2
2
44
21
23
 17
17
423
31
291
 0.4
0.4
10
3
2
 1.1
1.1
28
3
2
 -
-
-
-
-
 0.4
0.4
11
3
9
 0.7
0.7
18
3
3
 19
19
476
19
449
 0.5
0.5
14
3
0
 0.5
0.5
14
3
2
 0.6
0.6
16
3
1
 5
5
131
14
79
 20
20
523
12
50
 100
100
2561
17
4370
 0.1
0.1
2
12
0
 22
22
560
26
485
 0.9
0.9
23
18
16
Evolution
Species Conservation
PhosphoNET % Identity:
PhosphoNET % Similarity:
Homologene %
Identity:
PhosphoNET % Identity:
PhosphoNET % Similarity:
Homologene %
Identity:
 100
100
100
100 58
58
72.6
95 44.2
44.2
60.9
- -
-
-
85.5 -
-
-
- 81.6
81.6
86.4
89 -
-
-
- 86
86
90.3
88 -
-
-
90 -
-
-
- 70.8
70.8
79.4
- 57.3
57.3
73.5
81 -
-
-
88 54.4
54.4
71.5
76 -
-
-
- -
-
-
48 -
-
-
- -
-
-
25 45.4
45.4
62.2
- -
-
-
- -
-
-
- -
-
-
- -
-
-
36 -
-
-
- -
-
-
-
For a wider analysis go to PhosphoNET Evolution in PhosphoNET
Regulation
Activation:
Activated by phosphorylation at Thr-812.
Inhibition:
Contains an N-terminal autoinhibitory domain. ; inhibited by phosphorylation at Ser-924 and Ser-994
Synthesis:
NA
Degradation:
NA
Protein Kinase Specificity
Matrix of observed frequency (%) of amino acids in aligned protein substrate phosphosites
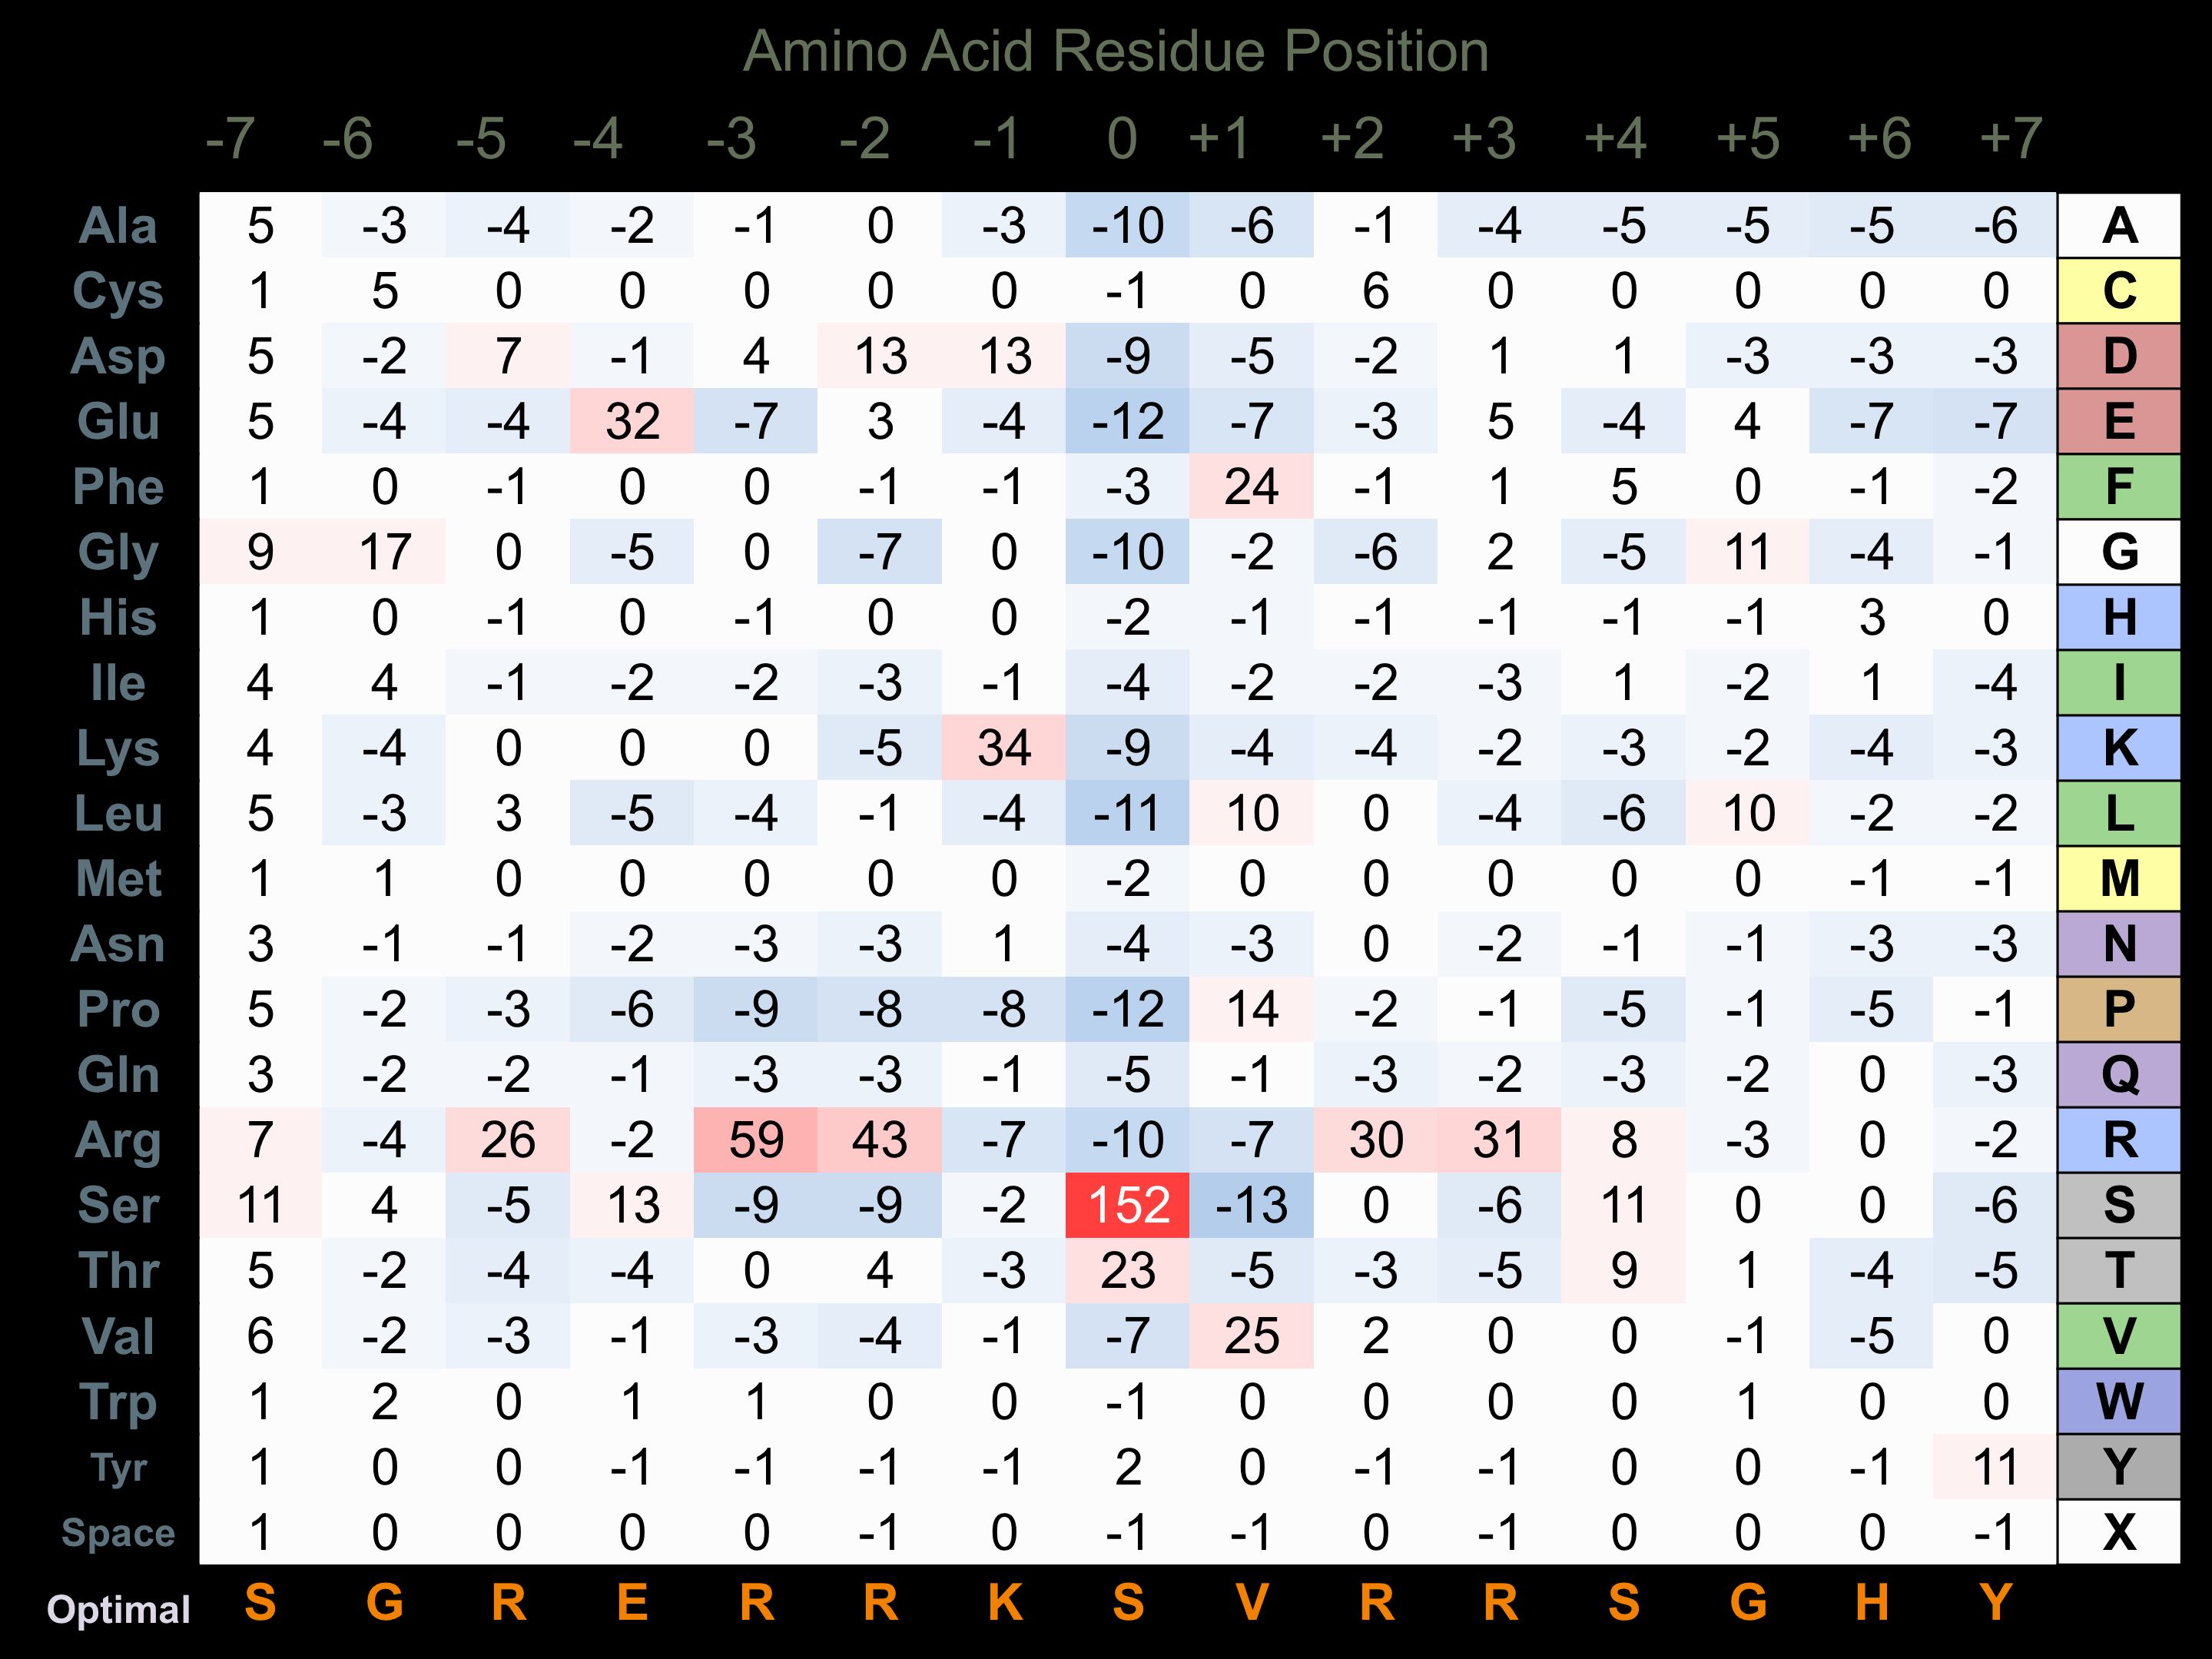
Matrix Type:
Predicted from the application of the Kinexus Kinase Substrate Predictor Version 2.0 algorithm, which was trained with over 10,000 kinase-protein substrate pairs and 8,000 kinase-peptide substrate pairs.
Domain #:
1
Inhibitors
For further details on these inhibitors click on the Compound Name and enter it into DrugKiNET or click on the ID's
Based on in vitro and/or in vivo phosphorylation data
| Compound Name | KD, Ki or IC50 (nM) | PubChem ID | ChEMBL ID | PubMed ID |
|---|
| Staurosporine | Kd = 2.5 nM | 5279 | 22037378 | |
| Lestaurtinib | Kd = 3.4 nM | 126565 | 22037378 | |
| NVP-TAE684 | Kd = 800 nM | 16038120 | 509032 | 22037378 |
| WZ3146 | Kd > 1 µM | 44607360 | 20033049 | |
| WZ4002 | Kd > 1 µM | 44607530 | 20033049 | |
| Crizotinib | Kd = 1.1 µM | 11626560 | 601719 | 22037378 |
| Ruxolitinib | Kd = 1.1 µM | 25126798 | 1789941 | 22037378 |
| SU14813 | Kd = 1.2 µM | 10138259 | 1721885 | 22037378 |
| Sunitinib | Kd = 1.3 µM | 5329102 | 535 | 19654408 |
| Nintedanib | Kd = 1.4 µM | 9809715 | 502835 | 22037378 |
| AST-487 | Kd = 1.8 µM | 11409972 | 574738 | 22037378 |
| JNJ-28312141 | Kd = 2.5 µM | 22037378 | ||
| PP242 | Kd = 2.5 µM | 25243800 | 22037378 | |
| Pazopanib | Kd = 2.9 µM | 10113978 | 477772 | 22037378 |
| R547 | Kd = 3.5 µM | 6918852 | 22037378 | |
| Bosutinib | Kd = 4.4 µM | 5328940 | 288441 | 22037378 |
Disease Linkage
Comments:
An inhibitor of MAP3K15 may be useful for treatment of rheumatoid arthritis.
Mutagenesis Experiments:
Insertional mutagenesis studies in mice support a role for this protein kinase in mouse cancer oncogenesis.
Mutation Rate in All Cancers:
Percent mutation rates per 100 amino acids length in human cancers: 0.05 % in 24814 diverse cancer specimens. This rate is only -31 % lower than the average rate of 0.075 % calculated for human protein kinases in general.
Mutation Rate in Specific Cancers:
Highest percent mutation rates per 100 amino acids length in human cancers: 0.28 % in 805 skin cancers tested; 0.2 % in 1257 large intestine cancers tested; 0.19 % in 603 endometrium cancers tested; 0.19 % in 273 cervix cancers tested; 0.15 % in 569 stomach cancers tested; 0.12 % in 238 bone cancers tested; 0.09 % in 1796 lung cancers tested; 0.08 % in 274 central nervous system cancers tested.
Frequency of Mutated Sites:
Most frequent mutations with the number of reports indicated in brackets: A350P (7).
Comments:
Only 2 deletions, 1 insertion, and no complex mutations are noted on the COSMIC website.