
Nomenclature
Short Name:
ZC4
Full Name:
Novel protein similar to mouse Nik-related kinase
Alias:
- NRK
Classification
Type:
Protein-serine/threonine kinase
Group:
STE
Family:
STE20
SubFamily:
MSN

Structure
Mol. Mass (Da):
178,479
# Amino Acids:
1582
# mRNA Isoforms:
3
mRNA Isoforms:
178,479 Da (1582 AA; Q7Z2Y5); 140,606 Da (1250 AA; Q7Z2Y5-2); 21,368 Da (188 AA; Q7Z2Y5-3)
4D Structure:
NA
1D Structure:
Subfamily Alignment
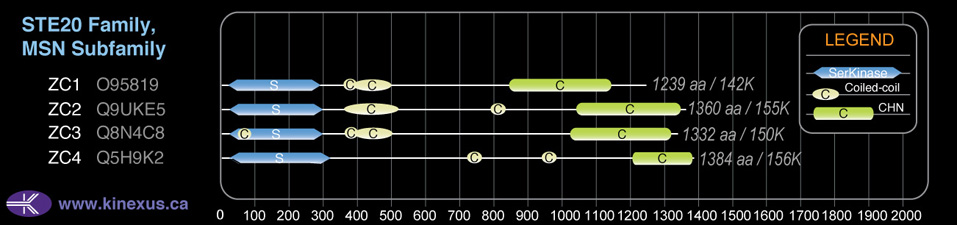
Domain Distribution:
| Start | End | Domain |
|---|---|---|
| 25 | 313 | Pkinase |
| 735 | 755 | Coiled-coil |
| 952 | 972 | Coiled-coil |
| 1209 | 1552 | CNH |
Post-translation Modifications
For detailed information on phosphorylation of this kinase go to PhosphoNET
Acetylated:
K702.
Serine phosphorylated:
S211, S811, S852, S855, S859, S1027, S1031, S1034, S1359, S1362.
Threonine phosphorylated:
T1242.
Tyrosine phosphorylated:
Y858, Y885, Y893, Y984, Y985, Y1016, Y1191.
Distribution
Based on gene microarray analysis from the NCBI
Human Tissue Distribution
% Max Expression:
Mean Expression:
Number of Samples:
Standard Deviation:
% Max Expression:
Mean Expression:
Number of Samples:
Standard Deviation:
 64
64
1465
12
1039
 17
17
388
7
673
 -
-
-
-
-
 33
33
763
65
2524
 20
20
457
20
349
 0.2
0.2
4
18
4
 0.3
0.3
6
23
6
 100
100
2288
15
4630
 0.1
0.1
2
3
1
 3
3
79
59
120
 4
4
93
11
202
 20
20
450
23
385
 18
18
409
2
50
 35
35
803
5
1417
 8
8
187
11
489
 11
11
261
12
222
 9
9
198
154
2163
 13
13
290
5
429
 6
6
129
41
497
 19
19
426
61
334
 3
3
58
11
123
 0.2
0.2
4
9
2
 -
-
-
-
-
 35
35
802
7
886
 6
6
136
11
300
 46
46
1042
42
2238
 16
16
376
5
531
 23
23
517
5
737
 22
22
502
5
801
 2
2
53
28
48
 30
30
688
12
91
 3
3
69
12
38
 0.1
0.1
3
24
1
 23
23
516
52
445
 2
2
37
35
25
Evolution
Species Conservation
PhosphoNET % Identity:
PhosphoNET % Similarity:
Homologene %
Identity:
PhosphoNET % Identity:
PhosphoNET % Similarity:
Homologene %
Identity:
 100
100
100
100 93.8
93.8
94
99 31.6
31.6
47.1
96.5 -
-
-
86 -
-
-
- 88.3
88.3
92.9
88.5 -
-
-
- 64.7
64.7
75.4
71 22.3
22.3
38.3
64 -
-
-
- 27.8
27.8
40.1
- 32.1
32.1
47.5
- -
-
-
- -
-
-
- -
-
-
- -
-
-
- -
-
-
- 29.4
29.4
44.5
- -
-
-
- -
-
-
- -
-
-
- -
-
-
- -
-
-
- -
-
-
- -
-
-
-
For a wider analysis go to PhosphoNET Evolution in PhosphoNET
Regulation
Activation:
NA
Inhibition:
NA
Synthesis:
NA
Degradation:
NA
Protein Kinase Specificity
Matrix of observed frequency (%) of amino acids in aligned protein substrate phosphosites
Matrix Type:
Predicted from the application of the Kinexus Kinase Substrate Predictor Version 2.0 algorithm, which was trained with over 10,000 kinase-protein substrate pairs and 8,000 kinase-peptide substrate pairs.
Domain #:
1
Disease Linkage
General Disease Association:
Bone disorder
Specific Diseases (Non-cancerous):
Hypermobility syndrome
Comments:
Hypermobility Syndrome is a bone condition where joints can be hyperextended. Other tissues that can be affected include the bone, testes, and skin.
Gene Expression in Cancers:
TranscriptoNET (www.transcriptonet.ca) analysis with mRNA expression data retrieved from the National Center for Biotechnology Information's Gene Expression Omnibus (GEO) database, which was normalized against 60 abundantly and commonly found proteins, indicated altered expression for this protein kinase as shown here as the percent change from normal tissue controls (%CFC) as supported with the Student T-test in the following types of human cancers: Clear cell renal cell carcinomas (cRCC) (%CFC= -61, p<0.092); and Ovary adenocarcinomas (%CFC= -64, p<0.059).
Mutagenesis Experiments:
Insertional mutagenesis studies in mice have not yet revealed a role for this protein kinase in mouse cancer oncogenesis.
Mutation Rate in All Cancers:
Percent mutation rates per 100 amino acids length in human cancers: 0.09 % in 24451 diverse cancer specimens. This rate is only 19 % higher than the average rate of 0.075 % calculated for human protein kinases in general.
Mutation Rate in Specific Cancers:
Highest percent mutation rates per 100 amino acids length in human cancers: 0.53 % in 864 skin cancers tested; 0.28 % in 569 stomach cancers tested; 0.28 % in 1229 large intestine cancers tested; 0.21 % in 603 endometrium cancers tested; 0.2 % in 1608 lung cancers tested; 0.15 % in 710 oesophagus cancers tested; 0.12 % in 273 cervix cancers tested; 0.08 % in 946 upper aerodigestive tract cancers tested; 0.08 % in 1437 pancreas cancers tested; 0.08 % in 1289 breast cancers tested; 0.06 % in 1512 liver cancers tested; 0.05 % in 238 bone cancers tested; 0.05 % in 127 biliary tract cancers tested; 0.04 % in 2030 central nervous system cancers tested.
Frequency of Mutated Sites:
Most frequent mutations with the number of reports indicated in brackets: S108P (3); R439 (3); K781* (3).
Comments:
Only 8 deletions, 4 insertions, and no complex mutations are noted on the COSMIC website.