
Nomenclature
Short Name:
SCYL3
Full Name:
Protein-associating with the carboxyl-terminal domain of ezrin
Alias:
- Ezrin-binding partner PACE-1
- PACE1
- PACE-1
- SCY1-like 3
Classification
Type:
Protein-serine/threonine kinase
Group:
Other
Family:
SCY1
SubFamily:
NA

Structure
Mol. Mass (Da):
82857
# Amino Acids:
742
# mRNA Isoforms:
2
mRNA Isoforms:
82,857 Da (742 AA; Q8IZE3); 76,731 Da (688 AA; Q8IZE3-2)
4D Structure:
Interacts with EZR/VIL2 C-terminal domain.
1D Structure:
Subfamily Alignment
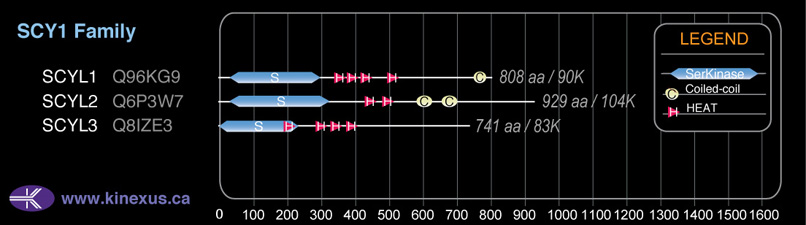
Domain Distribution:
Post-translation Modifications
For detailed information on phosphorylation of this kinase go to PhosphoNET
Serine phosphorylated:
S389, S391, S405, S439, S513, S533, S568, S642, S651, S707.
Threonine phosphorylated:
T153.
Ubiquitinated:
K272.
Distribution
Based on gene microarray analysis from the NCBI
Human Tissue Distribution
% Max Expression:
Mean Expression:
Number of Samples:
Standard Deviation:
% Max Expression:
Mean Expression:
Number of Samples:
Standard Deviation:
 89
89
844
29
994
 3
3
32
17
24
 12
12
116
14
103
 23
23
221
95
369
 92
92
867
25
719
 5
5
44
74
17
 35
35
329
35
491
 32
32
301
45
424
 55
55
521
17
415
 7
7
69
101
69
 6
6
60
39
58
 61
61
572
179
619
 8
8
75
36
59
 5
5
46
15
21
 9
9
88
33
109
 4
4
42
16
20
 22
22
207
212
1914
 10
10
94
25
88
 7
7
63
95
41
 69
69
655
109
681
 6
6
52
31
41
 8
8
77
35
85
 8
8
77
16
65
 10
10
91
25
85
 10
10
91
31
101
 59
59
560
57
649
 8
8
74
39
54
 7
7
65
25
54
 7
7
66
25
56
 7
7
63
28
43
 100
100
944
36
596
 66
66
620
36
611
 15
15
145
64
427
 98
98
925
52
744
 10
10
92
44
75
Evolution
Species Conservation
PhosphoNET % Identity:
PhosphoNET % Similarity:
Homologene %
Identity:
PhosphoNET % Identity:
PhosphoNET % Similarity:
Homologene %
Identity:
 100
100
100
100 98.9
98.9
99.2
99 95.2
95.2
96.8
96 -
-
-
84 -
-
-
- 85.6
85.6
90.3
86 -
-
-
- 80.7
80.7
87.7
81 21.9
21.9
38.5
81.5 -
-
-
- 31.9
31.9
37.4
- 62
62
71.6
69 21.9
21.9
39.1
59 52
52
67.6
55 -
-
-
- 25.7
25.7
46
30 28.4
28.4
49.7
- -
-
-
- 33.6
33.6
50.7
- -
-
-
- -
-
-
- -
-
-
- -
-
-
- -
-
-
- -
-
-
-
For a wider analysis go to PhosphoNET Evolution in PhosphoNET
Binding Proteins
Examples of known interacting proteins
hiddentext
| No. | Name – UniProt ID |
|---|---|
| 1 | CD44 - P16070 |
Regulation
Activation:
NA
Inhibition:
NA
Synthesis:
NA
Degradation:
NA
Protein Kinase Specificity
Matrix of observed frequency (%) of amino acids in aligned protein substrate phosphosites
Matrix Type:
Predicted from the application of the Kinexus Kinase Substrate Predictor Version 2.0 algorithm, which was trained with over 10,000 kinase-protein substrate pairs and 8,000 kinase-peptide substrate pairs.
Domain #:
1
Disease Linkage
Gene Expression in Cancers:
TranscriptoNET (www.transcriptonet.ca) analysis with mRNA expression data retrieved from the National Center for Biotechnology Information's Gene Expression Omnibus (GEO) database, which was normalized against 60 abundantly and commonly found proteins, indicated altered expression for this protein kinase as shown here as the percent change from normal tissue controls (%CFC) as supported with the Student T-test in the following types of human cancers: Bladder carcinomas (%CFC= +62, p<0.0008); and Breast epithelial carcinomas (%CFC= +102, p<0.073). The COSMIC website notes an up-regulated expression score for SCYL3 in diverse human cancers of 1034, which is 2.2-fold of the average score of 462 for the human protein kinases. The down-regulated expression score of 89 for this protein kinase in human cancers was 1.5-fold of the average score of 60 for the human protein kinases.
Mutagenesis Experiments:
Insertional mutagenesis studies in mice have not yet revealed a role for this protein kinase in mouse cancer oncogenesis.
Mutation Rate in All Cancers:
Percent mutation rates per 100 amino acids length in human cancers: 0.06 % in 24751 diverse cancer specimens. This rate is only -24 % lower than the average rate of 0.075 % calculated for human protein kinases in general.
Mutation Rate in Specific Cancers:
Highest percent mutation rates per 100 amino acids length in human cancers: 0.25 % in 1270 large intestine cancers tested; 0.22 % in 603 endometrium cancers tested; 0.21 % in 589 stomach cancers tested; 0.2 % in 548 urinary tract cancers tested; 0.19 % in 864 skin cancers tested; 0.11 % in 238 bone cancers tested; 0.09 % in 710 oesophagus cancers tested; 0.08 % in 1316 breast cancers tested; 0.06 % in 942 upper aerodigestive tract cancers tested; 0.06 % in 881 prostate cancers tested; 0.05 % in 273 cervix cancers tested; 0.05 % in 1276 kidney cancers tested; 0.03 % in 1634 lung cancers tested; 0.02 % in 833 ovary cancers tested; 0.02 % in 558 thyroid cancers tested; 0.02 % in 2103 central nervous system cancers tested; 0.02 % in 1512 liver cancers tested; 0.01 % in 2009 haematopoietic and lymphoid cancers tested; 0.01 % in 1459 pancreas cancers tested.
Frequency of Mutated Sites:
Most frequent mutations with the number of reports indicated in brackets: R61C (5).
Comments:
Only 6 deletions, 1 insertion, and no complex mutations are noted on the COSMIC website.