
Nomenclature
Short Name:
TAF1L
Full Name:
Transcription initiation factor TFIID 210 kDa subunit
Alias:
- Transcription initiation factor TFIID 210 kDa subunit
Classification
Type:
Protein-serine/threonine kinase
Group:
Atypical
Family:
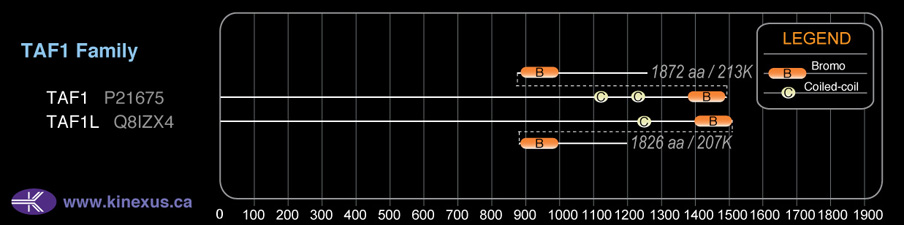
TAF1
SubFamily:
NA

Structure
Mol. Mass (Da):
207,302
# Amino Acids:
1826
# mRNA Isoforms:
1
mRNA Isoforms:
207,302 Da (1826 AA; Q8IZX4)
4D Structure:
Can bind directly to TATA-box binding protein (TBP).
1D Structure:
Subfamily Alignment
Domain Distribution:
| Start | End | Domain |
|---|---|---|
| 1231 | 1264 | Coiled-coil |
| 1416 | 1486 | BROMO |
| 1539 | 1609 | BROMO |
Post-translation Modifications
For detailed information on phosphorylation of this kinase go to PhosphoNET
Acetylated:
K724, K1263, K1366, K1373.
Serine phosphorylated:
S306, S543, S1174, S1359, S1410, S1583, S1652.
Threonine phosphorylated:
T564, T874, T1173, T1398, T1403.
Tyrosine phosphorylated:
Y1385, Y1560, Y1581, Y1669.
Ubiquitinated:
K720, K724.
Distribution
Based on gene microarray analysis from the NCBI
Human Tissue Distribution
% Max Expression:
Mean Expression:
Number of Samples:
Standard Deviation:
% Max Expression:
Mean Expression:
Number of Samples:
Standard Deviation:
 100
100
2980
6
1597
 0.3
0.3
8
7
3
 -
-
-
-
-
 0.8
0.8
24
29
15
 12
12
356
13
335
 0.4
0.4
11
9
9
 0.2
0.2
7
16
3
 0.2
0.2
6
6
3
 0.2
0.2
6
6
2
 0.2
0.2
7
6
2
 0.1
0.1
4
6
2
 23
23
687
12
708
 -
-
-
-
-
 0.5
0.5
15
6
5
 0.1
0.1
4
6
3
 0.5
0.5
16
5
9
 0.5
0.5
14
10
12
 0.1
0.1
3
6
2
 0.1
0.1
4
6
2
 15
15
456
29
284
 0.2
0.2
5
6
2
 0.3
0.3
10
6
2
 -
-
-
-
-
 0.4
0.4
12
6
3
 0.3
0.3
8
6
2
 16
16
463
22
535
 0.3
0.3
8
6
2
 0.2
0.2
6
6
4
 0.2
0.2
7
6
4
 -
-
-
-
-
 44
44
1319
12
75
 23
23
678
11
2131
 0.2
0.2
7
12
1
 22
22
666
26
570
 4
4
121
22
73
Evolution
Species Conservation
PhosphoNET % Identity:
PhosphoNET % Similarity:
Homologene %
Identity:
PhosphoNET % Identity:
PhosphoNET % Similarity:
Homologene %
Identity:
 100
100
100
100 0
0
0
98 -
-
-
95 -
-
-
- -
-
-
- 86.5
86.5
90.6
- -
-
-
- 84.8
84.8
89.7
- 85.3
85.3
89.9
- -
-
-
- 30.3
30.3
36.4
- -
-
-
- -
-
-
- 71
71
78.8
- -
-
-
- 43.4
43.4
58.6
- 45.9
45.9
59.5
- 30
30
49.4
- 49.2
49.2
63.8
- -
-
-
- -
-
-
- -
-
-
- 20
20
38.2
- -
-
-
26 -
-
-
-
For a wider analysis go to PhosphoNET Evolution in PhosphoNET
Binding Proteins
Examples of known interacting proteins
hiddentext
| No. | Name – UniProt ID |
|---|---|
| 1 | TAF8 - Q7Z7C8 |
| 2 | TAF6 - P49848 |
| 3 | TAF5 - Q15542 |
| 4 | TAF11 - Q15544 |
| 5 | TAF12 - Q16514 |
| 6 | TAF9 - Q16594 |
| 7 | TAF7 - Q15545 |
| 8 | TAF4 - O00268 |
| 9 | TBP - P20226 |
| 10 | RB1 - P06400 |
| 11 | CCND1 - P24385 |
| 12 | CSNK2A1 - P68400 |
| 13 | ASF1A - Q9Y294 |
| 14 | MSX1 - P28360 |
| 15 | FOS - P01100 |
Regulation
Activation:
NA
Inhibition:
NA
Synthesis:
NA
Degradation:
NA
Disease Linkage
Gene Expression in Cancers:
The COSMIC website notes an up-regulated expression score for TAF1L in diverse human cancers of 342, which is 0.7-fold of the average score of 462 for the human protein kinases. The down-regulated expression score of 17 for this protein kinase in human cancers was 0.3-fold of the average score of 60 for the human protein kinases.
Mutagenesis Experiments:
Insertional mutagenesis studies in mice have not yet revealed a role for this protein kinase in mouse cancer oncogenesis.
Mutation Rate in All Cancers:
Percent mutation rates per 100 amino acids length in human cancers: 0.12 % in 24909 diverse cancer specimens. This rate is 1.64-fold higher than the average rate of 0.075 % calculated for human protein kinases in general.
Mutation Rate in Specific Cancers:
Highest percent mutation rates per 100 amino acids length in human cancers: 0.55 % in 864 skin cancers tested; 0.51 % in 1346 large intestine cancers tested; 0.35 % in 1684 lung cancers tested; 0.29 % in 603 endometrium cancers tested; 0.24 % in 589 stomach cancers tested; 0.18 % in 273 cervix cancers tested; 0.1 % in 710 oesophagus cancers tested; 0.1 % in 1512 liver cancers tested; 0.1 % in 1372 breast cancers tested; 0.08 % in 65 Meninges cancers tested; 0.08 % in 548 urinary tract cancers tested; 0.07 % in 1276 kidney cancers tested; 0.06 % in 881 prostate cancers tested; 0.06 % in 2082 central nervous system cancers tested; 0.06 % in 1459 pancreas cancers tested; 0.05 % in 833 ovary cancers tested; 0.04 % in 127 biliary tract cancers tested.
Frequency of Mutated Sites:
Most frequent mutations with the number of reports indicated in brackets: R783C (6); R588Q (5); P553S (4); R685C (3); R636H (3); R888C (3).
Comments:
Over 20 deletion mutations (11 at K665fs*4), 4 insertion mutations (2 at A666fs*38), and 6 complex mutations are noted on the COSMIC website.