
Nomenclature
Short Name:
ALK7
Full Name:
Activin receptor type 1C
Alias:
- Activin A receptor type IC
- EC 2.7.11.30
- Activin receptor-like kinase 7
- ACV1C
- ACVR1C
- ACVRLK7
Classification
Type:
Protein-serine/threonine kinase
Group:
TKL
Family:
STKR
SubFamily:
Type1

Structure
Mol. Mass (Da):
54,871
# Amino Acids:
493
# mRNA Isoforms:
4
mRNA Isoforms:
54,871 Da (493 AA; Q8NER5); 49,684 Da (443 AA; Q8NER5-4); 46,357 Da (413 AA; Q8NER5-3); 37,461 Da (336 AA; Q8NER5-2)
4D Structure:
Binds the type 2 receptor protein ACVR2A
1D Structure:
Subfamily Alignment
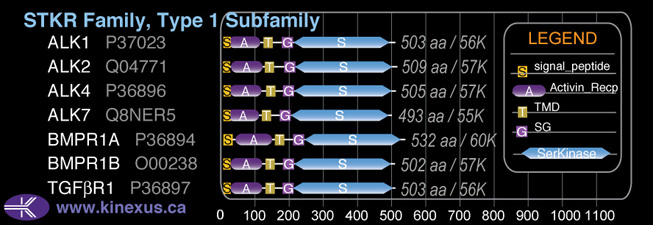
Domain Distribution:
| Start | End | Domain |
|---|---|---|
| 1 | 21 | signal_peptide |
| 26 | 100 | Activin_recp |
| 114 | 136 | TMD |
| 165 | 194 | GS |
| 195 | 487 | Pkinase |
Distribution
Based on gene microarray analysis from the NCBI
Human Tissue Distribution
% Max Expression:
Mean Expression:
Number of Samples:
Standard Deviation:
% Max Expression:
Mean Expression:
Number of Samples:
Standard Deviation:
 20
20
1907
12
1259
 3
3
284
7
465
 -
-
-
-
-
 3
3
243
51
186
 7
7
648
17
381
 0.1
0.1
9
18
6
 1
1
89
23
72
 3
3
302
5
524
 0.02
0.02
2
3
0
 6
6
604
5
836
 5
5
511
5
699
 7
7
679
17
380
 5
5
429
2
196
 4
4
403
5
848
 6
6
556
5
808
 2
2
169
12
355
 0.8
0.8
75
13
161
 5
5
433
5
597
 7
7
641
5
954
 8
8
774
51
517
 3
3
282
5
442
 0.02
0.02
2
3
0
 -
-
-
-
-
 5
5
490
7
740
 2
2
229
5
311
 5
5
500
37
473
 3
3
275
5
379
 3
3
321
5
439
 2
2
218
5
396
 -
-
-
-
-
 9
9
856
12
68
 100
100
9398
22
14290
 0.02
0.02
2
24
1
 7
7
702
52
613
 0.4
0.4
35
35
24
Evolution
Species Conservation
PhosphoNET % Identity:
PhosphoNET % Similarity:
Homologene %
Identity:
PhosphoNET % Identity:
PhosphoNET % Similarity:
Homologene %
Identity:
 100
100
100
100 99.8
99.8
99.8
100 99.2
99.2
99.6
99 -
-
-
98 -
-
-
- 88.9
88.9
92.3
92 -
-
-
- 92.7
92.7
96.5
94 92.5
92.5
96.3
95 -
-
-
- 85.5
85.5
92.5
- 50.2
50.2
65.5
84 29.6
29.6
45.6
79.5 63.6
63.6
77.2
- -
-
-
- -
-
-
- -
-
-
- 29
29
43
- -
-
-
- -
-
-
- -
-
-
- -
-
-
- -
-
-
- -
-
-
- -
-
-
-
For a wider analysis go to PhosphoNET Evolution in PhosphoNET
Binding Proteins
Examples of known interacting proteins
hiddentext
| No. | Name – UniProt ID |
|---|---|
| 1 | TDGF1 - P13385 |
| 2 | TDGF3 - P51864 |
| 3 | INHBB - P09529 |
| 4 | DIABLO - Q9NR28 |
| 5 | ENG - P17813 |
| 6 | SMAD4 - Q13485 |
Regulation
Activation:
NA
Inhibition:
NA
Synthesis:
NA
Degradation:
NA
Protein Kinase Specificity
Matrix of observed frequency (%) of amino acids in aligned protein substrate phosphosites
Matrix Type:
Predicted from the application of the Kinexus Kinase Substrate Predictor Version 2.0 algorithm, which was trained with over 10,000 kinase-protein substrate pairs and 8,000 kinase-peptide substrate pairs.
Domain #:
1
Inhibitors
For further details on these inhibitors click on the Compound Name and enter it into DrugKiNET or click on the ID's
Based on in vitro and/or in vivo phosphorylation data
| Compound Name | KD, Ki or IC50 (nM) | PubChem ID | ChEMBL ID | PubMed ID |
|---|
| JNJ-28312141 | Kd = 10 nM | 22037378 | ||
| PP242 | Kd = 58 nM | 25243800 | 22037378 | |
| Lestaurtinib | Kd = 86 nM | 126565 | 22037378 | |
| PD173955 | Kd = 96 nM | 447077 | 386051 | 22037378 |
| NVP-TAE684 | Kd = 97 nM | 16038120 | 509032 | 22037378 |
| Dasatinib | Kd = 330 nM | 11153014 | 1421 | 22037378 |
| Staurosporine | Kd = 680 nM | 5279 | 22037378 | |
| Crizotinib | Kd = 860 nM | 11626560 | 601719 | 22037378 |
| WZ3146 | Kd > 1 µM | 44607360 | 20033049 | |
| WZ4002 | Kd > 1 µM | 44607530 | 20033049 | |
| R406 | Kd = 1.1 µM | 11984591 | 22037378 | |
| CHEMBL249097 | Kd < 1.25 µM | 25138012 | 249097 | 19035792 |
| Hesperadin | Kd < 1.25 µM | 10142586 | 514409 | 19035792 |
| SureCN7018367 | Kd < 1.25 µM | 18792927 | 450519 | 19035792 |
| Cediranib | Kd = 1.5 µM | 9933475 | 491473 | 22037378 |
| GDC0879 | Kd = 2.4 µM | 11717001 | 525191 | 22037378 |
| LY364947 | Kd < 2.5 µM | 447966 | 261454 | 19035792 |
| SB203580 | Kd = 3 µM | 176155 | 10 | 22037378 |
| Nintedanib | Kd = 4.9 µM | 9809715 | 502835 | 22037378 |
Disease Linkage
General Disease Association:
Musculoskeletal disorders
Specific Diseases (Non-cancerous):
Myositis ossificans
Comments:
In mice studies, ALK7 knock-out mice showed reduced fat accumulation and some resistance to diet-induced obesity.
Gene Expression in Cancers:
The COSMIC website notes an up-regulated expression score for ALK7 in diverse human cancers of 402, which is 0.9-fold of the average score of 462 for the human protein kinases. The down-regulated expression score of 0 for this protein kinase in human cancers was 100% lower than the average score of 60 for the human protein kinases.
Mutagenesis Experiments:
Insertional mutagenesis studies in mice have not yet revealed a role for this protein kinase in mouse cancer oncogenesis. The gain of function T194D mutation promote apoptosis. The K222R loss of function mutation (in kinase subdomain II) leads to loss of response to NODAL and SMAD2 phosphorylation and reduced apoptosis.
Mutation Rate in All Cancers:
Percent mutation rates per 100 amino acids length in human cancers: 0.11 % in 25398 diverse cancer specimens. This rate is a modest 1.46-fold higher than the average rate of 0.075 % calculated for human protein kinases in general.
Mutation Rate in Specific Cancers:
Highest percent mutation rates per 100 amino acids length in human cancers: 0.66 % in 864 skin cancers tested; 0.32 % in 1270 large intestine cancers tested; 0.31 % in 65 Meninges cancers tested; 0.3 % in 603 endometrium cancers tested; 0.27 % in 2008 lung cancers tested; 0.24 % in 589 stomach cancers tested; 0.08 % in 958 upper aerodigestive tract cancers tested.
Frequency of Mutated Sites:
None > 8 in 20,681 cancer specimens
Comments:
Only 1 deletion and 1 complex mutation and no insertions mutations are noted on the COSMIC website.