
Nomenclature
Short Name:
MYO3A
Full Name:
Myosin IIIA
Alias:
- Class III myosin
- EC 2.7.11.1
- MY3A
- Myosin IIIA
Classification
Type:
Protein-serine/threonine kinase
Group:
STE
Family:
STE20
SubFamily:
NinaC

Structure
Mol. Mass (Da):
186208
# Amino Acids:
1616
# mRNA Isoforms:
2
mRNA Isoforms:
186,208 Da (1616 AA; Q8NEV4); 27,678 Da (247 AA; Q8NEV4-2)
4D Structure:
NA
1D Structure:
Subfamily Alignment
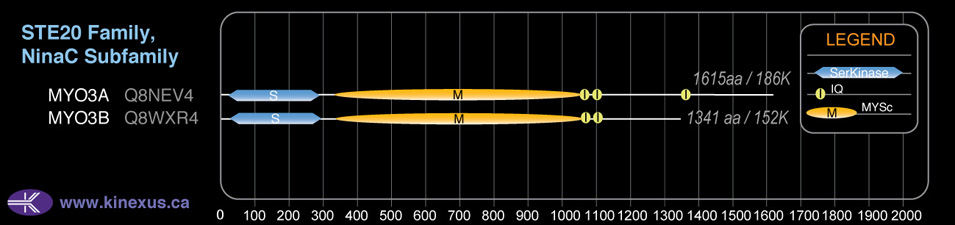
Domain Distribution:
Post-translation Modifications
For detailed information on phosphorylation of this kinase go to PhosphoNET
Acetylated:
K1306.
Serine phosphorylated:
S73, S177, S688, S1167, S1280, S1355.
Threonine phosphorylated:
T178, T184, T188, T302, T853, T908, T919, T1279.
Tyrosine phosphorylated:
Y82, Y85, Y509, Y1125, Y1394, Y1396, Y1459, .
Distribution
Based on gene microarray analysis from the NCBI
Human Tissue Distribution
% Max Expression:
Mean Expression:
Number of Samples:
Standard Deviation:
% Max Expression:
Mean Expression:
Number of Samples:
Standard Deviation:
 56
56
666
25
819
 0.5
0.5
6
10
7
 4
4
48
22
78
 22
22
259
122
2022
 30
30
359
31
246
 0.5
0.5
6
55
7
 0.4
0.4
5
35
6
 19
19
222
36
425
 17
17
204
10
212
 3
3
37
72
63
 4
4
43
36
78
 41
41
484
109
511
 3
3
34
36
90
 0.7
0.7
8
6
10
 4
4
43
9
72
 0.3
0.3
4
17
4
 5
5
55
132
50
 3
3
38
30
64
 1.1
1.1
13
88
21
 27
27
318
107
257
 3
3
34
39
69
 3
3
37
31
77
 4
4
42
33
82
 4
4
50
39
51
 5
5
55
32
94
 30
30
359
78
449
 2
2
28
33
62
 3
3
36
37
88
 3
3
31
37
77
 11
11
127
28
118
 31
31
373
18
275
 100
100
1194
31
2447
 14
14
172
67
550
 56
56
663
78
588
 18
18
209
48
298
Evolution
Species Conservation
PhosphoNET % Identity:
PhosphoNET % Similarity:
Homologene %
Identity:
PhosphoNET % Identity:
PhosphoNET % Similarity:
Homologene %
Identity:
 100
100
100
100 98
98
98.5
99 95.4
95.4
97.1
96 -
-
-
86.5 -
-
-
- 75.5
75.5
80.4
87 -
-
-
- 81.7
81.7
88.9
82 71.8
71.8
78.5
83 -
-
-
- 60.1
60.1
72.6
- 67.5
67.5
79.1
71 -
-
-
65 56.3
56.3
70.3
62 -
-
-
- 28.2
28.2
46.5
38 41
41
58
- -
-
-
- -
-
-
- -
-
-
- -
-
-
- -
-
-
- -
-
-
- -
-
-
- -
-
-
-
For a wider analysis go to PhosphoNET Evolution in PhosphoNET
Binding Proteins
Examples of known interacting proteins
hiddentext
| No. | Name – UniProt ID |
|---|---|
| 1 | TGFBR1 - P36897 |
Regulation
Activation:
NA
Inhibition:
NA
Synthesis:
NA
Degradation:
NA
Protein Kinase Specificity
Matrix of observed frequency (%) of amino acids in aligned protein substrate phosphosites
Matrix Type:
Predicted from the application of the Kinexus Kinase Substrate Predictor Version 2.0 algorithm, which was trained with over 10,000 kinase-protein substrate pairs and 8,000 kinase-peptide substrate pairs.
Domain #:
1
Inhibitors
For further details on these inhibitors click on the Compound Name and enter it into DrugKiNET or click on the ID's
Based on in vitro and/or in vivo phosphorylation data
| Compound Name | KD, Ki or IC50 (nM) | PubChem ID | ChEMBL ID | PubMed ID |
|---|
| AST-487 | Kd = 41 nM | 11409972 | 574738 | 18183025 |
| NVP-TAE684 | Kd = 67 nM | 16038120 | 509032 | 22037378 |
| Lestaurtinib | Kd = 260 nM | 126565 | 22037378 | |
| Staurosporine | Kd = 500 nM | 5279 | 18183025 | |
| KW2449 | Kd = 740 nM | 11427553 | 1908397 | 22037378 |
| PP242 | Kd = 830 nM | 25243800 | 22037378 | |
| WZ3146 | Kd > 1 µM | 44607360 | 20033049 | |
| WZ4002 | Kd > 1 µM | 44607530 | 20033049 | |
| SU14813 | Kd = 1.4 µM | 10138259 | 1721885 | 22037378 |
| Axitinib | Kd = 1.9 µM | 6450551 | 1289926 | 22037378 |
| Foretinib | Kd = 2.8 µM | 42642645 | 1230609 | 22037378 |
| Sunitinib | Kd = 3.1 µM | 5329102 | 535 | 22037378 |
| BMS-690514 | Kd < 4 µM | 11349170 | 21531814 |
Disease Linkage
General Disease Association:
Ear disorders
Specific Diseases (Non-cancerous):
Deafness, autosomal recessive 30; Deafness, autosomal recessive 76; Dfnb30 nonsyndromic hearing loss and deafness
Comments:
Three different recessive mutations leading to loss of function have been shown to cause deafness, autosomal recessive, 30, or other nonsyndromic progressive hearing loss diseases.
Gene Expression in Cancers:
TranscriptoNET (www.transcriptonet.ca) analysis with mRNA expression data retrieved from the National Center for Biotechnology Information's Gene Expression Omnibus (GEO) database, which was normalized against 60 abundantly and commonly found proteins, indicated altered expression for this protein kinase as shown here as the percent change from normal tissue controls (%CFC) as supported with the Student T-test in human Bladder carcinomas (%CFC= -50, p<0.0004). The COSMIC website notes an up-regulated expression score for MYO3A in diverse human cancers of 364, which is 0.8-fold of the average score of 462 for the human protein kinases. The down-regulated expression score of 0 for this protein kinase in human cancers was 100% lower than the average score of 60 for the human protein kinases.
Mutagenesis Experiments:
Insertional mutagenesis studies in mice have not yet revealed a role for this protein kinase in mouse cancer oncogenesis.
Mutation Rate in All Cancers:
Percent mutation rates per 100 amino acids length in human cancers: 0.13 % in 25086 diverse cancer specimens. This rate is 1.7-fold higher than the average rate of 0.075 % calculated for human protein kinases in general.
Mutation Rate in Specific Cancers:
Highest percent mutation rates per 100 amino acids length in human cancers: 0.62 % in 10 peritoneum cancers tested; 0.5 % in 1270 large intestine cancers tested; 0.38 % in 589 stomach cancers tested; 0.33 % in 603 endometrium cancers tested; 0.23 % in 1824 lung cancers tested; 0.15 % in 834 ovary cancers tested; 0.15 % in 710 oesophagus cancers tested; 0.14 % in 548 urinary tract cancers tested; 0.14 % in 1512 liver cancers tested; 0.11 % in 1372 breast cancers tested; 0.1 % in 881 prostate cancers tested; 0.09 % in 1364 kidney cancers tested; 0.08 % in 2082 central nervous system cancers tested; 0.05 % in 273 cervix cancers tested; 0.04 % in 152 biliary tract cancers tested.
Frequency of Mutated Sites:
Most frequent mutations with the number of reports indicated in brackets: N525S (4); N525K (2); N525H (2).
Comments:
Eighteen deletions (12 at M1192fs*1), 3 insertions and no complex mutations are noted on the COSMIC website.