
Nomenclature
Short Name:
SgK288
Full Name:
Protein kinase PKK2
Alias:
- ANKK1
- ANKRD4
- Ankyrin repeat and kinase domain containing 1
- Ankyrin repeat domain protein 4
- EC 2.7.11.1
- X-kinase
Classification
Type:
Protein-serine/threonine kinase
Group:
TKL
Family:
RIPK
SubFamily:
NA

Structure
Mol. Mass (Da):
84,632
# Amino Acids:
765
# mRNA Isoforms:
1
mRNA Isoforms:
84,632 Da (765 AA; Q8NFD2)
4D Structure:
NA
1D Structure:
Subfamily Alignment
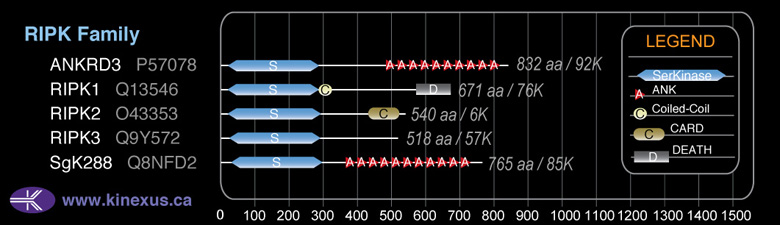
Domain Distribution:
Kinexus Products
Click on entries below for direct links to relevant products from Kinexus for this protein kinase.
hiddentext
Post-translation Modifications
For detailed information on phosphorylation of this kinase go to PhosphoNET
Acetylated:
K577.
Threonine phosphorylated:
T590, T694.
Tyrosine phosphorylated:
Y190, Y336.
Ubiquitinated:
K702.
Distribution
Based on gene microarray analysis from the NCBI
Human Tissue Distribution
% Max Expression:
Mean Expression:
Number of Samples:
Standard Deviation:
% Max Expression:
Mean Expression:
Number of Samples:
Standard Deviation:
 -
-
-
-
-
 0.2
0.2
2
3
0
 -
-
-
-
-
 0.2
0.2
2
3
1
 0.4
0.4
4
3
1

 0.2
0.2
2
3
0
 0.2
0.2
2
3
0
 0.2
0.2
2
3
0
 0.2
0.2
2
3
1
 0.1
0.1
1
3
0
 0.3
0.3
3
3
1
 -
-
-
-
-
 0.2
0.2
2
3
1
 0.5
0.5
5
3
3
 -
-
-
-
-
 0.2
0.2
2
3
1
 0.6
0.6
6
3
4
 0.2
0.2
2
3
0
 0.3
0.3
3
3
1
 0.3
0.3
3
3
0
 0.2
0.2
2
3
0
 -
-
-
-
-
 0.2
0.2
2
3
2
 0.2
0.2
2
3
0
 0.3
0.3
3
3
1
 0.2
0.2
2
3
1
 0.5
0.5
5
3
1
 0.2
0.2
2
3
0
 -
-
-
-
-
 100
100
955
12
59
 -
-
-
-
-
 -
-
-
-
-
 -
-
-
-
-
 4
4
41
9
82
Evolution
Species Conservation
PhosphoNET % Identity:
PhosphoNET % Similarity:
Homologene %
Identity:
PhosphoNET % Identity:
PhosphoNET % Similarity:
Homologene %
Identity:
 100
100
100
100 34.5
34.5
52.7
97 35
35
52.7
- -
-
-
65 -
-
-
- 82.3
82.3
89.4
83 -
-
-
- 76.5
76.5
84.7
79.5 22
22
35.2
79 -
-
-
- 33.4
33.4
50.3
- 22.5
22.5
39.1
63 34.4
34.4
52
55 21.7
21.7
37.1
43 -
-
-
- -
-
-
- -
-
-
- -
-
-
- -
-
-
- -
-
-
- -
-
-
- -
-
-
- -
-
-
29 -
-
-
- -
-
-
-
For a wider analysis go to PhosphoNET Evolution in PhosphoNET
Regulation
Activation:
NA
Inhibition:
NA
Synthesis:
NA
Degradation:
NA
Protein Kinase Specificity
Matrix of observed frequency (%) of amino acids in aligned protein substrate phosphosites
Matrix Type:
Predicted from the application of the Kinexus Kinase Substrate Predictor Version 2.0 algorithm, which was trained with over 10,000 kinase-protein substrate pairs and 8,000 kinase-peptide substrate pairs.
Domain #:
1
Inhibitors
For further details on these inhibitors click on the Compound Name and enter it into DrugKiNET or click on the ID's
Based on in vitro and/or in vivo phosphorylation data
| Compound Name | KD, Ki or IC50 (nM) | PubChem ID | ChEMBL ID | PubMed ID |
|---|
| Lestaurtinib | Kd = 32 nM | 126565 | 22037378 | |
| Dovitinib | Kd = 79 nM | 57336746 | 18183025 | |
| KW2449 | Kd = 82 nM | 11427553 | 1908397 | 22037378 |
| SU14813 | Kd = 160 nM | 10138259 | 1721885 | 18183025 |
| Staurosporine | Kd = 270 nM | 5279 | 18183025 | |
| Sunitinib | Kd = 310 nM | 5329102 | 535 | 18183025 |
| R406 | Kd = 330 nM | 11984591 | 22037378 | |
| Ruxolitinib | Kd = 390 nM | 25126798 | 1789941 | 22037378 |
| JNJ-7706621 | Kd = 500 nM | 5330790 | 191003 | 18183025 |
| AST-487 | Kd = 630 nM | 11409972 | 574738 | 18183025 |
| Crizotinib | Kd = 780 nM | 11626560 | 601719 | 22037378 |
| Doramapimod | Kd = 1 µM | 156422 | 103667 | 18183025 |
| WZ3146 | Kd > 1 µM | 44607360 | 20033049 | |
| WZ4002 | Kd > 1 µM | 44607530 | 20033049 | |
| Barasertib | Kd = 1.5 µM | 16007391 | 215152 | 18183025 |
| Foretinib | Kd = 1.5 µM | 42642645 | 1230609 | 22037378 |
| Bosutinib | Kd = 2.1 µM | 5328940 | 288441 | 22037378 |
| PP242 | Kd = 2.6 µM | 25243800 | 22037378 | |
| Axitinib | Kd = 3.6 µM | 6450551 | 1289926 | 22037378 |
| TG101348 | Kd = 4.3 µM | 16722836 | 1287853 | 22037378 |
| BMS-690514 | Kd < 4.5 µM | 11349170 | 21531814 |
Disease Linkage
General Disease Association:
Neurological disorders
Specific Diseases (Non-cancerous):
Nicotine dependence; Alcohol dependence; Heroin dependence; Antisocial personality disorder (ASP); Alexithymia; Traumatic brain Injury; Neuroleptic malignant syndrome; Tardive dyskinesia (TD); Bipolar I disorder; Dopamine receptor D2, reduced brain density of
Comments:
Antisocial Personality Disorder (ASP) is a rare mental disease which is characterized by a disregard of the rights of others. Alexithymia is characterized by an inability to identify or recognize their own personal emotions. The rare Neuroleptic Malignant Syndrome is a neuronal syndrome which can be characterized by sweating, high fever, fluxuating blood pressure, stupor, muscle rigidity, and autonomic dysfunction which can lead to life-threatening situations. Tardive Dyskinesia (TD) is characterized by involuntary movements that are repetitive and do not serve a purpose. TD can affect the tongue, eye, and brain tissues. Bipolar I Disorder is characterized by the onset of a manic period (elongated experience of elation or irritability) and it can affect the cortex, amygdala, and cingulate cortex.
Gene Expression in Cancers:
The COSMIC website notes an up-regulated expression score for SgK288 in diverse human cancers of 378, which is 0.8-fold of the average score of 462 for the human protein kinases. The down-regulated expression score of 0 for this protein kinase in human cancers was 100% lower than the average score of 60 for the human protein kinases.
Mutagenesis Experiments:
Insertional mutagenesis studies in mice have not yet revealed a role for this protein kinase in mouse cancer oncogenesis.
Mutation Rate in All Cancers:
Percent mutation rates per 100 amino acids length in human cancers: 0.07 % in 25020 diverse cancer specimens. This rate is only -5 % lower and is very similar to the average rate of 0.075 % calculated for human protein kinases in general.
Mutation Rate in Specific Cancers:
Highest percent mutation rates per 100 amino acids length in human cancers: 0.32 % in 864 skin cancers tested; 0.31 % in 1270 large intestine cancers tested; 0.26 % in 603 endometrium cancers tested; 0.15 % in 710 oesophagus cancers tested; 0.15 % in 1872 lung cancers tested; 0.1 % in 1512 liver cancers tested; 0.09 % in 589 stomach cancers tested; 0.06 % in 1372 breast cancers tested; 0.05 % in 273 cervix cancers tested.
Frequency of Mutated Sites:
None > 3 in 20,303 cancer specimens
Comments:
Only 1 deletion, 1 insertion, and 1 complex mutation are noted on the COSMIC website.