
Nomenclature
Short Name:
YANK1
Full Name:
Serine/threonine-protein kinase 32A
Alias:
- STK32A
- BG036777
- BE567816
Classification
Type:
Protein-serine/threonine kinase
Group:
AGC
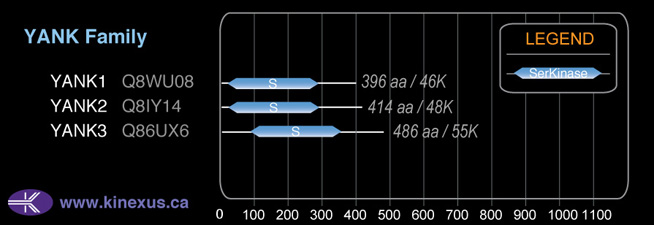
Family:
YANK
SubFamily:
NA

Structure
Mol. Mass (Da):
46,369
# Amino Acids:
396
# mRNA Isoforms:
3
mRNA Isoforms:
46,369 Da (396 AA; Q8WU08); 41,699 Da (358 AA; Q8WU08-3); 19,792 Da (166 AA; Q8WU08-2)
4D Structure:
NA
1D Structure:
3D Image (rendered using PV Viewer):
PDB ID
Subfamily Alignment
Domain Distribution:
| Start | End | Domain |
|---|---|---|
| 23 | 281 | Pkinase |
Post-translation Modifications
For detailed information on phosphorylation of this kinase go to PhosphoNET
Serine phosphorylated:
S194.
Threonine phosphorylated:
T175.
Tyrosine phosphorylated:
Y49.
Distribution
Based on gene microarray analysis from the NCBI
Human Tissue Distribution
% Max Expression:
Mean Expression:
Number of Samples:
Standard Deviation:
% Max Expression:
Mean Expression:
Number of Samples:
Standard Deviation:
 100
100
1355
15
1338
 0.4
0.4
6
5
1
 -
-
-
-
-
 1
1
13
49
11
 32
32
437
17
213
 0.2
0.2
3
18
4
 0.4
0.4
6
23
5
 0.4
0.4
6
3
4
 0.2
0.2
3
3
0
 0.7
0.7
10
3
11
 0.1
0.1
2
3
2
 52
52
710
15
368
 -
-
-
-
-
 0.2
0.2
3
3
0
 0.5
0.5
7
3
3
 0.7
0.7
9
10
6
 0.4
0.4
6
11
6
 0.2
0.2
3
3
3
 0.3
0.3
4
3
3
 32
32
438
49
184
 0.4
0.4
5
3
1
 0.3
0.3
4
3
3
 -
-
-
-
-
 0.2
0.2
3
3
1
 0.4
0.4
5
3
2
 39
39
525
35
454
 0.2
0.2
3
3
0
 0.5
0.5
7
3
7
 0.3
0.3
4
3
2
 -
-
-
-
-
 36
36
493
12
42
 47
47
643
16
1334
 0.1
0.1
2
24
0
 44
44
602
52
518
 4
4
57
35
27
Evolution
Species Conservation
PhosphoNET % Identity:
PhosphoNET % Similarity:
Homologene %
Identity:
PhosphoNET % Identity:
PhosphoNET % Similarity:
Homologene %
Identity:
 100
100
100
100 99.4
99.4
99.4
99.5 97.2
97.2
97.4
96 -
-
-
92 -
-
-
- 67.4
67.4
70.5
88 -
-
-
- 90.1
90.1
95.4
91 23.6
23.6
37.1
90 -
-
-
- 45.3
45.3
54.1
- 21
21
33.6
77.5 72.4
72.4
82.5
75 63.3
63.3
76.7
- -
-
-
- 30.5
30.5
51.2
- 49.4
49.4
62.6
- 22.6
22.6
34.4
- 53.2
53.2
69.3
- -
-
-
- -
-
-
- -
-
-
- -
-
-
- -
-
-
- -
-
-
44
For a wider analysis go to PhosphoNET Evolution in PhosphoNET
Regulation
Activation:
NA
Inhibition:
NA
Synthesis:
NA
Degradation:
NA
Protein Kinase Specificity
Matrix of observed frequency (%) of amino acids in aligned protein substrate phosphosites
Matrix Type:
Predicted from the application of the Kinexus Kinase Substrate Predictor Version 2.0 algorithm, which was trained with over 10,000 kinase-protein substrate pairs and 8,000 kinase-peptide substrate pairs.
Domain #:
1
Inhibitors
For further details on these inhibitors click on the Compound Name and enter it into DrugKiNET or click on the ID's
Based on in vitro and/or in vivo phosphorylation data
| Compound Name | KD, Ki or IC50 (nM) | PubChem ID | ChEMBL ID | PubMed ID |
|---|
| NVP-TAE684 | Kd = 13 nM | 16038120 | 509032 | 22037378 |
| Staurosporine | Kd = 13 nM | 5279 | 22037378 | |
| Linifanib | Kd = 640 nM | 11485656 | 223360 | 22037378 |
| PP242 | Kd = 690 nM | 25243800 | 22037378 | |
| WZ3146 | Kd > 1 µM | 44607360 | 20033049 | |
| WZ4002 | Kd > 1 µM | 44607530 | 20033049 | |
| SB203580 | Kd = 1.3 µM | 176155 | 10 | 22037378 |
| Bosutinib | Kd = 1.8 µM | 5328940 | 288441 | 22037378 |
| Lestaurtinib | Kd = 2.1 µM | 126565 | 22037378 | |
| R406 | Kd = 2.3 µM | 11984591 | 22037378 | |
| N-Benzoylstaurosporine | Kd = 2.4 µM | 56603681 | 608533 | 22037378 |
| PD173955 | Kd = 2.5 µM | 447077 | 386051 | 22037378 |
| KW2449 | Kd = 4.4 µM | 11427553 | 1908397 | 22037378 |
Disease Linkage
General Disease Association:
Cancer
Specific Cancer Types:
Lung
Comments:
YANK1 may be a tumour requiring protein (TRP), since it displays extremely low rates of mutation in human cancers. Through genome-wide association study, YANK1 has been identified in a lung cancer susceptibility locus.
Mutagenesis Experiments:
Insertional mutagenesis studies in mice have not yet revealed a role for this protein kinase in mouse cancer oncogenesis. A G2A mutation in YANK1 can localize the kinase to the cytoplasm.
Mutation Rate in All Cancers:
Percent mutation rates per 100 amino acids length in human cancers: 0.01 % in 24434 diverse cancer specimens. This rate is -82 % lower than the average rate of 0.075 % calculated for human protein kinases in general. Such a very low frequency of mutation in human cancers is consistent with this protein kinase playing a role as a tumour requiring protein (TRP).
Mutation Rate in Specific Cancers:
Highest percent mutation rates per 100 amino acids length in human cancers: 0.4 % in 1270 large intestine cancers tested; 0.34 % in 589 stomach cancers tested; 0.26 % in 864 skin cancers tested; 0.21 % in 603 endometrium cancers tested; 0.11 % in 238 bone cancers tested; 0.11 % in 1822 lung cancers tested; 0.1 % in 1512 liver cancers tested; 0.1 % in 1316 breast cancers tested; 0.09 % in 273 cervix cancers tested; 0.06 % in 441 autonomic ganglia cancers tested; 0.05 % in 548 urinary tract cancers tested; 0.05 % in 1459 pancreas cancers tested; 0.04 % in 710 oesophagus cancers tested; 0.04 % in 1276 kidney cancers tested; 0.03 % in 942 upper aerodigestive tract cancers tested; 0.03 % in 2009 haematopoietic and lymphoid cancers tested; 0.01 % in 2082 central nervous system cancers tested.
Frequency of Mutated Sites:
None > 4 in 20,197 cancer specimens
Comments:
Only 4 deletions, and no insertions or complex mutations are noted on the COSMIC website.