
Nomenclature
Short Name:
SCYL1
Full Name:
Kinase-like protein
Alias:
- Coated vesicle-associated kinase of 90 kDa
- SCY1-like protein 1
- Telomerase regulation-associated protein
- Telomerase transcriptional element-interacting factor
- Teratoma-associated tyrosine kinase
Classification
Type:
Protein-serine/threonine kinase
Group:
Other
Family:
SCY1
SubFamily:
NA

Structure
Mol. Mass (Da):
89,631
# Amino Acids:
808
# mRNA Isoforms:
6
mRNA Isoforms:
89,631 Da (808 AA; Q96KG9); 88,089 Da (791 AA; Q96KG9-2); 86,371 Da (787 AA; Q96KG9-6); 86,312 Da (781 AA; Q96KG9-4); 78,696 Da (707 AA; Q96KG9-3); 69,238 Da (626 AA; Q96KG9-5)
4D Structure:
Interacts with SCYL1BP1. Interacts with COPA, COPB1 and COPB2 By similarity. Homooligomer. Interacts with AP2B1.
1D Structure:
Subfamily Alignment
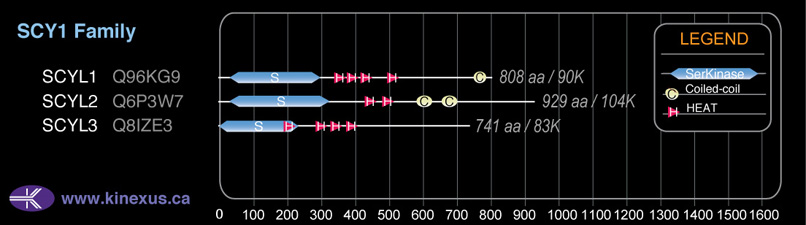
Domain Distribution:
Kinexus Products
Click on entries below for direct links to relevant products from Kinexus for this protein kinase.
hiddentext
Post-translation Modifications
For detailed information on phosphorylation of this kinase go to PhosphoNET
Myristoylated:
G2.
Serine phosphorylated:
S44, S568, S638, S639, S681, S747, S754.
Threonine phosphorylated:
T39, T275, T332, T469, T634, T640, T741.
Tyrosine phosphorylated:
Y48, Y725.
Distribution
Based on gene microarray analysis from the NCBI
Human Tissue Distribution
% Max Expression:
Mean Expression:
Number of Samples:
Standard Deviation:
% Max Expression:
Mean Expression:
Number of Samples:
Standard Deviation:
 58
58
1075
15
856
 24
24
447
10
833
 8
8
157
6
172
 11
11
196
72
435
 32
32
585
24
568
 3
3
48
18
49
 2
2
30
26
26
 100
100
1856
26
3003
 1.1
1.1
21
6
3
 7
7
127
66
166
 15
15
274
18
497
 36
36
672
30
644
 16
16
293
8
282
 14
14
262
8
510
 13
13
237
12
566
 12
12
227
12
306
 11
11
208
103
1021
 8
8
157
14
213
 13
13
233
50
791
 33
33
604
64
510
 11
11
209
18
367
 6
6
118
16
147
 8
8
153
6
165
 18
18
339
16
522
 9
9
166
18
212
 62
62
1142
54
1728
 8
8
150
14
250
 17
17
324
14
570
 10
10
186
14
289
 6
6
120
28
69
 70
70
1306
12
54
 5
5
88
18
65
 13
13
250
60
817
 42
42
785
52
642
 10
10
187
35
132
Evolution
Species Conservation
PhosphoNET % Identity:
PhosphoNET % Similarity:
Homologene %
Identity:
PhosphoNET % Identity:
PhosphoNET % Similarity:
Homologene %
Identity:
 100
100
100
100 0
0
0
99 94.3
94.3
95.3
95 -
-
-
92 -
-
-
- 83.6
83.6
86.5
94 -
-
-
- 90.9
90.9
93.5
92 90.8
90.8
93.9
92 -
-
-
- -
-
-
- -
-
-
- 65.1
65.1
76.9
71 64.8
64.8
74.8
70 -
-
-
- 45.9
45.9
61.1
53 41.9
41.9
57.9
- 36.3
36.3
54.2
42 46.2
46.2
59.4
- 32
32
51.1
- 32.2
32.2
50.5
- -
-
-
43 -
-
-
40 -
-
-
- -
-
-
37
For a wider analysis go to PhosphoNET Evolution in PhosphoNET
Binding Proteins
Examples of known interacting proteins
hiddentext
| No. | Name – UniProt ID |
|---|---|
| 1 | GORAB - Q5T7V8 |
| 2 | CD93 - Q9NPY3 |
| 3 | COIL - P38432 |
Regulation
Activation:
NA
Inhibition:
NA
Synthesis:
NA
Degradation:
NA
Protein Kinase Specificity
Matrix of observed frequency (%) of amino acids in aligned protein substrate phosphosites
Matrix Type:
Predicted from the application of the Kinexus Kinase Substrate Predictor Version 2.0 algorithm, which was trained with over 10,000 kinase-protein substrate pairs and 8,000 kinase-peptide substrate pairs.
Domain #:
1
Disease Linkage
Mutagenesis Experiments:
Insertional mutagenesis studies in mice have not yet revealed a role for this protein kinase in mouse cancer oncogenesis.
Mutation Rate in All Cancers:
Percent mutation rates per 100 amino acids length in human cancers: 0.06 % in 24433 diverse cancer specimens. This rate is only -24 % lower than the average rate of 0.075 % calculated for human protein kinases in general.
Mutation Rate in Specific Cancers:
Highest percent mutation rates per 100 amino acids length in human cancers: 0.19 % in 589 stomach cancers tested; 0.18 % in 1270 large intestine cancers tested; 0.17 % in 864 skin cancers tested; 0.16 % in 603 endometrium cancers tested; 0.09 % in 710 oesophagus cancers tested; 0.09 % in 548 urinary tract cancers tested; 0.09 % in 1512 liver cancers tested; 0.05 % in 238 bone cancers tested; 0.05 % in 1316 breast cancers tested; 0.05 % in 1276 kidney cancers tested; 0.04 % in 1634 lung cancers tested; 0.03 % in 942 upper aerodigestive tract cancers tested; 0.03 % in 833 ovary cancers tested; 0.02 % in 558 thyroid cancers tested; 0.02 % in 2103 central nervous system cancers tested; 0.02 % in 2009 haematopoietic and lymphoid cancers tested; 0.02 % in 1459 pancreas cancers tested; 0.01 % in 881 prostate cancers tested.
Frequency of Mutated Sites:
Most frequent mutations with the number of reports indicated in brackets: R271H (3).
Comments:
Only 4 deletions, 1 insertion, and no complex mutations are noted on the COSMIC website.