
Nomenclature
Short Name:
NEK1
Full Name:
Serine-threonine-protein kinase Nek1
Alias:
- EC 2.7.11.1
- KIAA1901
- NIMA (never in mitosis gene a)-related kinase 1
- NimA-related protein kinase 1
- NY-REN-55
- NY-REN-55 antigen
Classification
Type:
Protein-serine/threonine kinase
Group:
Other
Family:
NEK
SubFamily:
NA

Specific Links
Structure
Mol. Mass (Da):
142,828
# Amino Acids:
1258
# mRNA Isoforms:
6
mRNA Isoforms:
145,814 Da (1286 AA; Q96PY6-3); 142,828 Da (1258 AA; Q96PY6); 141,053 Da (1242 AA; Q96PY6-6); 138,068 Da (1214 AA; Q96PY6-2); 135,303 Da (1189 AA; Q96PY6-4); 60,250 Da (527 AA; Q96PY6-5)
4D Structure:
Binds to SPERT
1D Structure:
3D Image (rendered using PV Viewer):
PDB ID
Subfamily Alignment
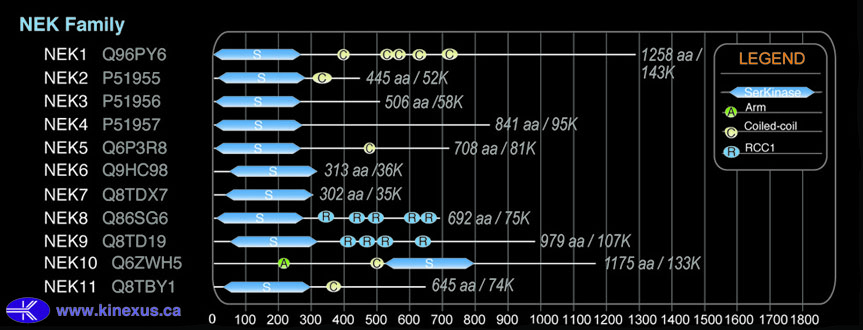
Domain Distribution:
| Start | End | Domain |
|---|---|---|
| 4 | 258 | Pkinase |
| 384 | 407 | Coiled-coil |
| 500 | 520 | Coiled-coil |
| 528 | 554 | Coiled-coil |
| 609 | 633 | Coiled-coil |
| 699 | 733 | Coiled-coil |
Kinexus Products
Click on entries below for direct links to relevant products from Kinexus for this protein kinase.
hiddentext
Post-translation Modifications
For detailed information on phosphorylation of this kinase go to PhosphoNET
Acetylated:
K322.
Serine phosphorylated:
S42, S155, S251, S414, S418, S428, S435, S438, S607, S653, S664, S798, S806, S834, S837, S868, S874, S878, S881, S885, S925, S1004, S1008, S1052, S1126, S1131.
Threonine phosphorylated:
T156, T344, T351, T661, T808, T848, T1050.
Tyrosine phosphorylated:
Y315, Y321, Y443, Y446, Y470, Y557, Y1125.
Ubiquitinated:
K130, K138.
Distribution
Based on gene microarray analysis from the NCBI
Human Tissue Distribution
% Max Expression:
Mean Expression:
Number of Samples:
Standard Deviation:
% Max Expression:
Mean Expression:
Number of Samples:
Standard Deviation:
 99
99
960
61
1033
 18
18
172
33
349
 4
4
36
4
33
 27
27
266
187
426
 66
66
642
51
533
 4
4
37
162
82
 15
15
142
69
329
 100
100
971
59
1713
 39
39
382
31
305
 11
11
109
144
262
 12
12
118
41
212
 63
63
607
304
571
 8
8
74
54
156
 45
45
441
24
955
 21
21
200
30
497
 8
8
78
40
155
 40
40
387
227
2897
 22
22
215
23
361
 16
16
157
157
541
 50
50
482
244
526
 11
11
103
29
130
 4
4
43
28
32
 5
5
51
8
29
 54
54
520
31
769
 11
11
108
29
209
 72
72
696
111
1038
 10
10
97
57
216
 16
16
153
24
325
 17
17
166
24
252
 25
25
239
56
294
 45
45
439
36
593
 45
45
437
83
503
 44
44
426
177
813
 83
83
804
130
694
 37
37
357
74
457
Evolution
Species Conservation
PhosphoNET % Identity:
PhosphoNET % Similarity:
Homologene %
Identity:
PhosphoNET % Identity:
PhosphoNET % Similarity:
Homologene %
Identity:
 100
100
100
100 99.7
99.7
99.8
100 97.5
97.5
98.4
98 -
-
-
83 -
-
-
- 85.1
85.1
90.8
87 -
-
-
- 79.3
79.3
85.6
83 46
46
48.6
82 -
-
-
- 30.3
30.3
44.4
- 66.3
66.3
78.1
62 22.4
22.4
39.3
62 22.7
22.7
34.4
50 -
-
-
- -
-
-
- -
-
-
- -
-
-
- 32.9
32.9
48.6
- -
-
-
- -
-
-
- -
-
-
- 21.9
21.9
33.7
- -
-
-
- 20.1
20.1
35.1
-
For a wider analysis go to PhosphoNET Evolution in PhosphoNET
Binding Proteins
Examples of known interacting proteins
hiddentext
| No. | Name – UniProt ID |
|---|---|
| 1 | MRE11A - P49959 |
| 2 | ZNF432 - O94892 |
| 3 | FEZ1 - Q99689 |
| 4 | YWHAH - Q04917 |
| 5 | CTNNAL1 - Q9UBT7 |
| 6 | ZNF350 - Q9GZX5 |
| 7 | PPP2R5A - Q15172 |
| 8 | TSC2 - P49815 |
| 9 | LZTS1 - Q9Y250 |
| 10 | ZNF615 - Q8N8J6 |
| 11 | PPP2R5D - Q14738 |
Regulation
Activation:
NA
Inhibition:
NA
Synthesis:
NA
Degradation:
NA
Known Downstream Substrates
For further details on these substrates click on the Substrate Short Name or UniProt ID. Phosphosite Location is hyperlinked to PhosphoNET
predictions.
Based on in vitro and/or in vivo phosphorylation data
| Substrate Short Name | UniProt ID (Human) | Phosphosite Location | Phosphosite Sequence | Effect of Phosphorylation |
|---|
Protein Kinase Specificity
Matrix of observed frequency (%) of amino acids in aligned protein substrate phosphosites
Matrix Type:
Predicted from the application of the Kinexus Kinase Substrate Predictor Version 2.0 algorithm, which was trained with over 10,000 kinase-protein substrate pairs and 8,000 kinase-peptide substrate pairs.
Domain #:
1
Inhibitors
For further details on these inhibitors click on the Compound Name and enter it into DrugKiNET or click on the ID's
Based on in vitro and/or in vivo phosphorylation data
| Compound Name | KD, Ki or IC50 (nM) | PubChem ID | ChEMBL ID | PubMed ID |
|---|
Disease Linkage
General Disease Association:
Nephrological, and bone growth disorders
Specific Diseases (Non-cancerous):
Polycystic kidney disease; Short rib-polydactyly syndrome; Short-rib thoracic dysplasia 6 with or without Polydactyly; Asphyxiating thoracic dystrophy (ATD); Sensenbrenner syndrome (CED); Short rib-polydactyly syndrome Type 2
Comments:
Polycystic Kidney Disease, Type 1 (PKD1) is a rare disease where multiple cysts develop in the kidney, often leading to kidney failure. Short Rib-Polydactyly Syndrome is a rare disease related to the polydactyly and asphyxiating thoracic dystrophy disorders. Short Rib-Polydactyly Syndrome characteristics can include extra short rib, underdeveloped lungs, intestine transposition, and kidney or urinary tract structural abnormalities. Asphyxiating Thoracic Dystrophy (ATD) is a bone growth rare disorder which can lead to short arms, short legs, abnormal pelvis shape, polydactyly (extra fingers), restricted expansion of the rib cage, and related health concerns. Sensenbrenner Syndrome (CED) is a bone development and ectoderm development rare disorder.
Gene Expression in Cancers:
TranscriptoNET (www.transcriptonet.ca) analysis with mRNA expression data retrieved from the National Center for Biotechnology Information's Gene Expression Omnibus (GEO) database, which was normalized against 60 abundantly and commonly found proteins, indicated altered expression for this protein kinase as shown here as the percent change from normal tissue controls (%CFC) as supported with the Student T-test in human Prostate cancer (%CFC= -45, p<0.065).
Mutagenesis Experiments:
Insertional mutagenesis studies in mice have not yet revealed a role for this protein kinase in mouse cancer oncogenesis.
Mutation Rate in All Cancers:
Percent mutation rates per 100 amino acids length in human cancers: 0.06 % in 24455 diverse cancer specimens. This rate is only -26 % lower than the average rate of 0.075 % calculated for human protein kinases in general.
Mutation Rate in Specific Cancers:
Highest percent mutation rates per 100 amino acids length in human cancers: 0.35 % in 1229 large intestine cancers tested; 0.16 % in 864 skin cancers tested; 0.16 % in 603 endometrium cancers tested; 0.16 % in 555 stomach cancers tested; 0.1 % in 710 oesophagus cancers tested; 0.09 % in 273 cervix cancers tested; 0.08 % in 1608 lung cancers tested; 0.07 % in 238 bone cancers tested; 0.06 % in 125 biliary tract cancers tested; 0.05 % in 1512 liver cancers tested.
Frequency of Mutated Sites:
None > 6 in 20,034 cancer specimens
Comments:
Seventeen deletions (7 at V665fs*34), and no insertions or complex mutations are noted on the COSMIC website.