
Nomenclature
Short Name:
RSKL1
Full Name:
Ribosomal protein S6 kinase, 52kDa, polypeptide 1
Alias:
- RPS6KC1
- RP11-434B7.1-002
Classification
Type:
Protein-serine/threonine kinase
Group:
AGC
Family:
RSKL
SubFamily:
NA

Structure
Mol. Mass (Da):
117,273
# Amino Acids:
1054
# mRNA Isoforms:
2
mRNA Isoforms:
118,682 Da (1066 AA; Q96S38); 117,273 Da (1054 AA; Q96S38-2)
4D Structure:
NA
1D Structure:
Subfamily Alignment
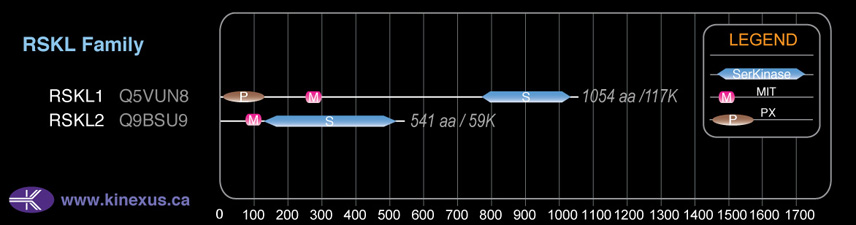
Domain Distribution:
Post-translation Modifications
For detailed information on phosphorylation of this kinase go to PhosphoNET
Serine phosphorylated:
S109, S118, S263, S281, S282, S332, S423, S427, S449, S455, S500, S528, S560, S583, S593, S596, S605, S608, S610, S640, S644, S661, S664, S667, S784, S823, S826, S866, S872.
Threonine phosphorylated:
T93, T284, T378, T437, T659.
Tyrosine phosphorylated:
Y15, Y27, Y30, Y259, Y266.
Ubiquitinated:
K651, K674, K759, K869.
Distribution
Based on gene microarray analysis from the NCBI
Human Tissue Distribution
% Max Expression:
Mean Expression:
Number of Samples:
Standard Deviation:
% Max Expression:
Mean Expression:
Number of Samples:
Standard Deviation:
 8
8
830
16
931
 0.3
0.3
34
11
25
 1.3
1.3
131
1
0
 5
5
462
49
493
 6
6
592
17
685
 0.7
0.7
68
37
22
 0.4
0.4
36
18
25
 5
5
518
21
829
 3
3
292
13
354
 0.6
0.6
62
38
33
 0.4
0.4
41
17
33
 8
8
747
79
663
 0.6
0.6
63
12
10
 0.4
0.4
37
9
25
 0.5
0.5
47
14
39
 1.1
1.1
110
7
25
 0.7
0.7
64
154
53
 0.3
0.3
29
9
35
 1.1
1.1
111
40
65
 5
5
521
59
564
 0.8
0.8
80
13
66
 0.5
0.5
50
15
37
 0.8
0.8
75
2
6
 0.7
0.7
65
9
80
 0.4
0.4
35
13
40
 6
6
567
29
643
 0.4
0.4
36
18
22
 0.3
0.3
27
9
33
 0.4
0.4
40
9
50
 0.5
0.5
50
14
37
 7
7
730
18
483
 4
4
418
21
497
 3
3
314
45
505
 12
12
1127
26
842
 100
100
9771
18
9186
Evolution
Species Conservation
PhosphoNET % Identity:
PhosphoNET % Similarity:
Homologene %
Identity:
PhosphoNET % Identity:
PhosphoNET % Similarity:
Homologene %
Identity:
 100
100
100
100 99.9
99.9
99.9
100 -
-
-
96 -
-
-
89.5 -
-
-
- 78.4
78.4
81.2
92 -
-
-
- 78.6
78.6
85.5
79 -
-
-
79 -
-
-
- 76
76
84.4
- -
-
-
72 -
-
-
61 -
-
-
- -
-
-
- -
-
-
36 -
-
-
- -
-
-
25 26.2
26.2
44
- -
-
-
- -
-
-
- -
-
-
- -
-
-
- -
-
-
- -
-
-
-
For a wider analysis go to PhosphoNET Evolution in PhosphoNET
Regulation
Activation:
NA
Inhibition:
NA
Synthesis:
NA
Degradation:
NA
Protein Kinase Specificity
Matrix of observed frequency (%) of amino acids in aligned protein substrate phosphosites
Matrix Type:
Predicted from the application of the Kinexus Kinase Substrate Predictor Version 2.0 algorithm, which was trained with over 10,000 kinase-protein substrate pairs and 8,000 kinase-peptide substrate pairs.
Domain #:
1
Disease Linkage
Gene Expression in Cancers:
TranscriptoNET (www.transcriptonet.ca) analysis with mRNA expression data retrieved from the National Center for Biotechnology Information's Gene Expression Omnibus (GEO) database, which was normalized against 60 abundantly and commonly found proteins, indicated altered expression for this protein kinase as shown here as the percent change from normal tissue controls (%CFC) as supported with the Student T-test in human Skin fibrosarcomas (%CFC= +61). The COSMIC website notes an up-regulated expression score for RSKL1 in diverse human cancers of 1003, which is 2.2-fold of the average score of 462 for the human protein kinases. The down-regulated expression score of 78 for this protein kinase in human cancers was 1.3-fold of the average score of 60 for the human protein kinases.
Mutagenesis Experiments:
Insertional mutagenesis studies in mice have not yet revealed a role for this protein kinase in mouse cancer oncogenesis.
Mutation Rate in All Cancers:
Percent mutation rates per 100 amino acids length in human cancers: 0.07 % in 24807 diverse cancer specimens. This rate is only -9 % lower and is very similar to the average rate of 0.075 % calculated for human protein kinases in general.
Mutation Rate in Specific Cancers:
Highest percent mutation rates per 100 amino acids length in human cancers: 0.35 % in 1270 large intestine cancers tested; 0.24 % in 864 skin cancers tested; 0.24 % in 603 endometrium cancers tested; 0.19 % in 589 stomach cancers tested; 0.16 % in 548 urinary tract cancers tested; 0.15 % in 1634 lung cancers tested; 0.09 % in 710 oesophagus cancers tested; 0.07 % in 127 biliary tract cancers tested; 0.06 % in 1512 liver cancers tested; 0.05 % in 833 ovary cancers tested; 0.04 % in 1316 breast cancers tested; 0.04 % in 1276 kidney cancers tested; 0.03 % in 942 upper aerodigestive tract cancers tested; 0.03 % in 273 cervix cancers tested; 0.02 % in 881 prostate cancers tested; 0.01 % in 2103 central nervous system cancers tested; 0.01 % in 2009 haematopoietic and lymphoid cancers tested; 0.01 % in 1459 pancreas cancers tested.
Frequency of Mutated Sites:
Most frequent mutations with the number of reports indicated in brackets: E1022E (6); E1022K (2); E1020G (2).
Comments:
Only 3 deletions, 2 insertions, and 1 complex mutation are noted on the COSMIC website.