
Nomenclature
Short Name:
TSSK1
Full Name:
Testis-specific serine-threonine protein kinase 1
Alias:
- EC 2.7.11.1
- FKSG81
- ST2A
- STK22A
- STK22D
- TSSK7P; Testis-specific kinase 1; Testis-specific serine kinase 1; TSK-1; TSSK-1;
- Serine/threonine protein kinase 22A
- Serine/threonine protein kinase FKSG81
- SPOGA1
- SPOGA4
Classification
Type:
Protein-serine/threonine kinase
Group:
CAMK
Family:
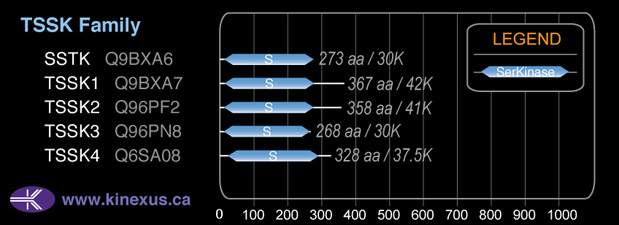
TSSK
SubFamily:
NA

Structure
Mol. Mass (Da):
41,618
# Amino Acids:
367
# mRNA Isoforms:
1
mRNA Isoforms:
41,618 Da (367 AA; Q9BXA7)
4D Structure:
NA
1D Structure:
Subfamily Alignment
Domain Distribution:
| Start | End | Domain |
|---|---|---|
| 12 | 272 | Pkinase |
Post-translation Modifications
For detailed information on phosphorylation of this kinase go to PhosphoNET
Acetylated:
K159.
Serine phosphorylated:
S172+, S279, S281, S290, S291.
Tyrosine phosphorylated:
Y197, Y207, Y216.
Distribution
Based on gene microarray analysis from the NCBI
Human Tissue Distribution
% Max Expression:
Mean Expression:
Number of Samples:
Standard Deviation:
% Max Expression:
Mean Expression:
Number of Samples:
Standard Deviation:
 5
5
282
16
582
 1.3
1.3
75
10
151
 0
0
2
1
0
 3
3
191
40
358
 5
5
270
11
214
 0
0
1
37
1
 0
0
2
15
1
 8
8
450
15
518
 3
3
198
10
206
 0.6
0.6
33
33
117
 0.9
0.9
51
12
112
 9
9
515
74
492
 0.4
0.4
23
14
54
 1.1
1.1
63
8
132
 1.2
1.2
68
9
164
 0.7
0.7
43
9
82
 0.4
0.4
21
15
51
 0.7
0.7
43
8
79
 2
2
90
39
397
 4
4
215
58
260
 1
1
57
8
104
 0
0
2
8
1
 0.1
0.1
4
2
1
 3
3
158
10
148
 0.7
0.7
44
8
76
 6
6
372
24
426
 0.4
0.4
21
17
52
 0.7
0.7
43
8
74
 1
1
57
8
99
 0.8
0.8
47
14
22
 8
8
449
18
331
 18
18
1071
29
2476
 0
0
2
17
1
 11
11
675
26
589
 100
100
5903
20
10438
Evolution
Species Conservation
PhosphoNET % Identity:
PhosphoNET % Similarity:
Homologene %
Identity:
PhosphoNET % Identity:
PhosphoNET % Similarity:
Homologene %
Identity:
 100
100
100
100 97.5
97.5
98.1
97.5 65.7
65.7
77.7
96 -
-
-
86 -
-
-
- 82.1
82.1
87.8
84 -
-
-
- 83.7
83.7
89.7
85 21
21
32.5
86 -
-
-
- 66.5
66.5
79
- 21.6
21.6
32.1
- -
-
-
- -
-
-
- -
-
-
- -
-
-
48 -
-
-
- -
-
-
42 41.7
41.7
57.2
- -
-
-
- -
-
-
- -
-
-
- 30.3
30.3
43.4
- -
-
-
- -
-
-
-
For a wider analysis go to PhosphoNET Evolution in PhosphoNET
Regulation
Activation:
Activated by phosphorylation on Thr-174, potentially by autophosphorylation.
Inhibition:
NA
Synthesis:
NA
Degradation:
NA
Protein Kinase Specificity
Matrix of observed frequency (%) of amino acids in aligned protein substrate phosphosites
Matrix Type:
Predicted from the application of the Kinexus Kinase Substrate Predictor Version 2.0 algorithm, which was trained with over 10,000 kinase-protein substrate pairs and 8,000 kinase-peptide substrate pairs.
Domain #:
1
Inhibitors
For further details on these inhibitors click on the Compound Name and enter it into DrugKiNET or click on the ID's
Based on in vitro and/or in vivo phosphorylation data
| Compound Name | KD, Ki or IC50 (nM) | PubChem ID | ChEMBL ID | PubMed ID |
|---|
Disease Linkage
Mutagenesis Experiments:
Insertional mutagenesis studies in mice have not yet revealed a role for this protein kinase in mouse cancer oncogenesis. A T174A mutation in TSSK1 can lead to abrogated phosphotransferase activity, while a T174E mutation can yield a constitutively active protein kinase.
Mutation Rate in All Cancers:
Percent mutation rates per 100 amino acids length in human cancers: 0.13 % in 24447 diverse cancer specimens. This rate is 1.8-fold higher than the average rate of 0.075 % calculated for human protein kinases in general.
Mutation Rate in Specific Cancers:
Highest percent mutation rates per 100 amino acids length in human cancers: 1.09 % in 1229 large intestine cancers tested; 0.76 % in 864 skin cancers tested; 0.45 % in 603 endometrium cancers tested; 0.29 % in 569 stomach cancers tested; 0.2 % in 548 urinary tract cancers tested; 0.15 % in 1608 lung cancers tested; 0.11 % in 238 bone cancers tested; 0.11 % in 1289 breast cancers tested; 0.1 % in 273 cervix cancers tested; 0.08 % in 710 oesophagus cancers tested; 0.07 % in 1982 haematopoietic and lymphoid cancers tested; 0.04 % in 1437 pancreas cancers tested.
Frequency of Mutated Sites:
Most frequent mutations with the number of reports indicated in brackets: R9* (4), E301K (4); R237C (3); R168* (3).
Comments:
Only 2 deletions, 1 insertion, and no complex mutations are noted on the COSMIC website.