
Nomenclature
Short Name:
SgK396
Full Name:
Serine-threonine-protein kinase 31
Alias:
- EC 2.7.11.1
- NYD-SPK
- Sugen kinase 396
- TDRD8
- SGK396
- Serine/threonine kinase 31
- Serine/threonine-protein kinase NYD-SPK
- SgK396
- ST31
Classification
Type:
Protein-serine/threonine kinase
Group:
Other
Family:
Other-Unique
SubFamily:
NA

Structure
Mol. Mass (Da):
115694
# Amino Acids:
1019
# mRNA Isoforms:
3
mRNA Isoforms:
115,694 Da (1019 AA; Q9BXU1); 113,260 Da (996 AA; Q9BXU1-2); 113,013 Da (996 AA; Q9BXU1-3)
4D Structure:
NA
1D Structure:
Subfamily Alignment
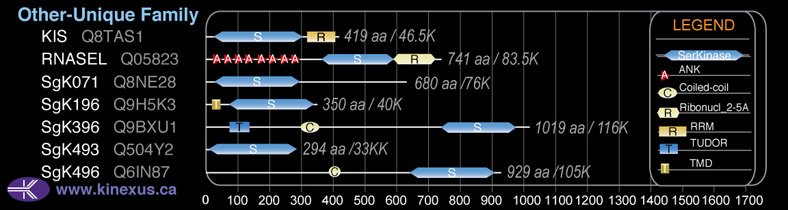
Domain Distribution:
| Start | End | Domain |
|---|---|---|
| 78 | 137 | TUDOR |
| 298 | 353 | Coiled-coil |
| 731 | 992 | Pkinase |
Post-translation Modifications
For detailed information on phosphorylation of this kinase go to PhosphoNET
Serine phosphorylated:
S125, S137, S138, S152, S451, S884.
Threonine phosphorylated:
T28, T119, T163, T182, T187, T278, T766.
Tyrosine phosphorylated:
Y30, Y449, Y482, Y777, Y992.
Distribution
Based on gene microarray analysis from the NCBI
Human Tissue Distribution
% Max Expression:
Mean Expression:
Number of Samples:
Standard Deviation:
% Max Expression:
Mean Expression:
Number of Samples:
Standard Deviation:
 63
63
401
9
534
 0.6
0.6
4
4
6
 1.3
1.3
8
28
15
 2
2
15
74
20
 43
43
270
13
246
 0.3
0.3
2
9
3
 0.6
0.6
4
13
4
 2
2
15
49
29
 0.2
0.2
1
3
1
 1.4
1.4
9
75
15
 1.1
1.1
7
38
15
 18
18
117
57
319
 1.4
1.4
9
34
12
 0.5
0.5
3
3
2
 3
3
18
40
16
 0.3
0.3
2
5
2
 2
2
10
47
15
 1.3
1.3
8
37
15
 1.3
1.3
8
67
13
 52
52
329
31
223
 2
2
10
47
13
 1.4
1.4
9
49
12
 2
2
11
27
14
 27
27
171
49
130
 2
2
10
39
13
 20
20
127
63
283
 1.1
1.1
7
49
13
 3
3
17
45
35
 1.3
1.3
8
30
13
 20
20
127
14
84
 92
92
583
24
65
 63
63
403
11
1212
 0.3
0.3
2
12
0
 100
100
635
26
552
 80
80
506
40
838
Evolution
Species Conservation
PhosphoNET % Identity:
PhosphoNET % Similarity:
Homologene %
Identity:
PhosphoNET % Identity:
PhosphoNET % Similarity:
Homologene %
Identity:
 100
100
100
100 99.3
99.3
99.7
99 93.5
93.5
96.4
95 -
-
-
84 -
-
-
- 82.2
82.2
89.6
83 -
-
-
- 78.1
78.1
88.2
78 78.4
78.4
88.5
79 -
-
-
- 51.2
51.2
63.4
- 49.3
49.3
65.3
56 -
-
-
49 -
-
-
37 -
-
-
- -
-
-
- -
-
-
- -
-
-
- -
-
-
- -
-
-
- -
-
-
- -
-
-
- -
-
-
- -
-
-
- -
-
-
-
For a wider analysis go to PhosphoNET Evolution in PhosphoNET
Regulation
Activation:
NA
Inhibition:
NA
Synthesis:
NA
Degradation:
NA
Protein Kinase Specificity
Matrix of observed frequency (%) of amino acids in aligned protein substrate phosphosites
Matrix Type:
Predicted from the application of the Kinexus Kinase Substrate Predictor Version 2.0 algorithm, which was trained with over 10,000 kinase-protein substrate pairs and 8,000 kinase-peptide substrate pairs.
Domain #:
1
Inhibitors
For further details on these inhibitors click on the Compound Name and enter it into DrugKiNET or click on the ID's
Based on in vitro and/or in vivo phosphorylation data
| Compound Name | KD, Ki or IC50 (nM) | PubChem ID | ChEMBL ID | PubMed ID |
|---|
| CHEMBL248757 | Ki > 1.442 µM | 44444843 | 248757 | 17935989 |
Disease Linkage
General Disease Association:
Cancer
Specific Cancer Types:
Colon cancer
Comments:
Sgk396 can modulate the differentiation state of colon cancer tissues.
Gene Expression in Cancers:
TranscriptoNET (www.transcriptonet.ca) analysis with mRNA expression data retrieved from the National Center for Biotechnology Information's Gene Expression Omnibus (GEO) database, which was normalized against 60 abundantly and commonly found proteins, indicated altered expression for this protein kinase as shown here as the percent change from normal tissue controls (%CFC) as supported with the Student T-test in the following types of human cancers: Ovary adenocarcinomas (%CFC= -96, p<0.0002). The COSMIC website notes an up-regulated expression score for SgK396 in diverse human cancers of 565, which is 1.2-fold of the average score of 462 for the human protein kinases. The down-regulated expression score of 0 for this protein kinase in human cancers was 100% lower than average score of 60 for the human protein kinases.
Mutagenesis Experiments:
Insertional mutagenesis studies in mice have not yet revealed a role for this protein kinase in mouse cancer oncogenesis.
Mutation Rate in All Cancers:
Percent mutation rates per 100 amino acids length in human cancers: 0.11 % in 24726 diverse cancer specimens. This rate is a modest 1.48-fold higher than the average rate of 0.075 % calculated for human protein kinases in general.
Mutation Rate in Specific Cancers:
Highest percent mutation rates per 100 amino acids length in human cancers: 0.92 % in 864 skin cancers tested; 0.38 % in 1270 large intestine cancers tested; 0.26 % in 603 endometrium cancers tested; 0.22 % in 1634 lung cancers tested; 0.2 % in 589 stomach cancers tested; 0.11 % in 548 urinary tract cancers tested; 0.1 % in 710 oesophagus cancers tested; 0.1 % in 1512 liver cancers tested; 0.1 % in 1316 breast cancers tested; 0.08 % in 238 bone cancers tested; 0.07 % in 273 cervix cancers tested; 0.07 % in 1459 pancreas cancers tested; 0.06 % in 833 ovary cancers tested; 0.05 % in 942 upper aerodigestive tract cancers tested; 0.05 % in 1276 kidney cancers tested; 0.04 % in 558 thyroid cancers tested.
Frequency of Mutated Sites:
Most frequent mutations with the number of reports indicated in brackets: M364I (5); D381N (3); R467C (3); R728* (3).
Comments:
Only 7 deletions, no insertions or complex mutations are noted on the COSMIC website.