
Nomenclature
Short Name:
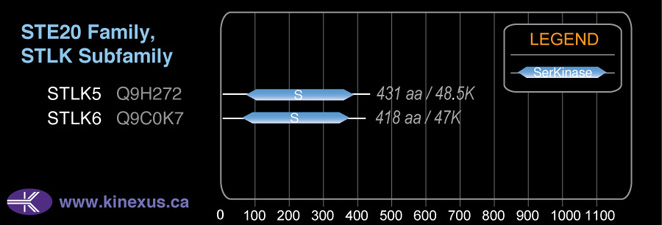
STLK6
Full Name:
Serine-threonine-protein kinase ALS2CR2
Alias:
- AL2S2
- ALS2CR2
- FLJ14731
- ILP-interacting protein ILPIPA
Classification
Type:
Protein-serine/threonine kinase
Group:
STE
Family:
STE20
SubFamily:
STLK

Structure
Mol. Mass (Da):
47,026
# Amino Acids:
418
# mRNA Isoforms:
3
mRNA Isoforms:
47,026 Da (418 AA; Q9C0K7); 42,371 Da (377 AA; Q9C0K7-2); 31,219 Da (280 AA; Q9C0K7-3)
4D Structure:
Interacts with BIRC4/XIAP. These two proteins are likely to coexist in a complex with TAK1, TRAF6, TAB1 and TAB2
1D Structure:
Subfamily Alignment
Domain Distribution:
| Start | End | Domain |
|---|---|---|
| 58 | 369 | Pkinase |
Post-translation Modifications
For detailed information on phosphorylation of this kinase go to PhosphoNET
Serine phosphorylated:
S304, S306, S310, S315.
Threonine phosphorylated:
T159.
Distribution
Based on gene microarray analysis from the NCBI
Human Tissue Distribution
% Max Expression:
Mean Expression:
Number of Samples:
Standard Deviation:
% Max Expression:
Mean Expression:
Number of Samples:
Standard Deviation:
 4
4
1317
9
777
 1.3
1.3
418
7
115
 0.3
0.3
94
9
61
 0.8
0.8
250
44
119
 2
2
799
16
649
 0.6
0.6
181
15
209
 0.7
0.7
235
16
71
 2
2
665
21
821
 0.9
0.9
289
6
90
 2
2
594
41
289
 2
2
674
17
297
 1.3
1.3
431
34
566
 0.5
0.5
146
9
92
 0.4
0.4
132
6
40
 0.5
0.5
172
17
84
 1.2
1.2
376
5
92
 0.3
0.3
110
81
76
 0.5
0.5
158
15
64
 3
3
1108
33
395
 2
2
707
34
499
 1.2
1.2
376
17
175
 0.6
0.6
188
17
230
 0.4
0.4
128
9
102
 0.7
0.7
217
15
101
 0.4
0.4
141
17
86
 2
2
775
35
733
 0.5
0.5
152
15
88
 0.3
0.3
84
15
72
 0.4
0.4
120
15
71
 100
100
32230
10
4222
 5
5
1528
12
52
 1.3
1.3
418
11
739
 0.9
0.9
304
36
483
 3
3
1093
26
823
 2
2
645
22
434
Evolution
Species Conservation
PhosphoNET % Identity:
PhosphoNET % Similarity:
Homologene %
Identity:
PhosphoNET % Identity:
PhosphoNET % Similarity:
Homologene %
Identity:
 100
100
100
100 67.5
67.5
67.7
100 98.6
98.6
99
99 -
-
-
94 -
-
-
96 93.1
93.1
95.9
94 -
-
-
- 90.9
90.9
95.7
91 43.3
43.3
58.4
90 -
-
-
- 62.6
62.6
71.3
- 43.1
43.1
57.9
72 58
58
74.5
62.5 37.6
37.6
47.9
- -
-
-
- 25.8
25.8
43.5
- -
-
-
- -
-
-
- 35.2
35.2
52.6
- -
-
-
- -
-
-
- -
-
-
- -
-
-
- -
-
-
- -
-
-
-
For a wider analysis go to PhosphoNET Evolution in PhosphoNET
Binding Proteins
Examples of known interacting proteins
hiddentext
| No. | Name – UniProt ID |
|---|---|
| 1 | XIAP - P98170 |
| 2 | TRAF6 - Q9Y4K3 |
| 3 | MAP3K7 - O43318 |
| 4 | STK11 - Q15831 |
| 5 | CAB39 - Q9Y376 |
| 6 | GRB2 - P62993 |
Regulation
Activation:
NA
Inhibition:
NA
Synthesis:
NA
Degradation:
NA
Protein Kinase Specificity
Matrix of observed frequency (%) of amino acids in aligned protein substrate phosphosites
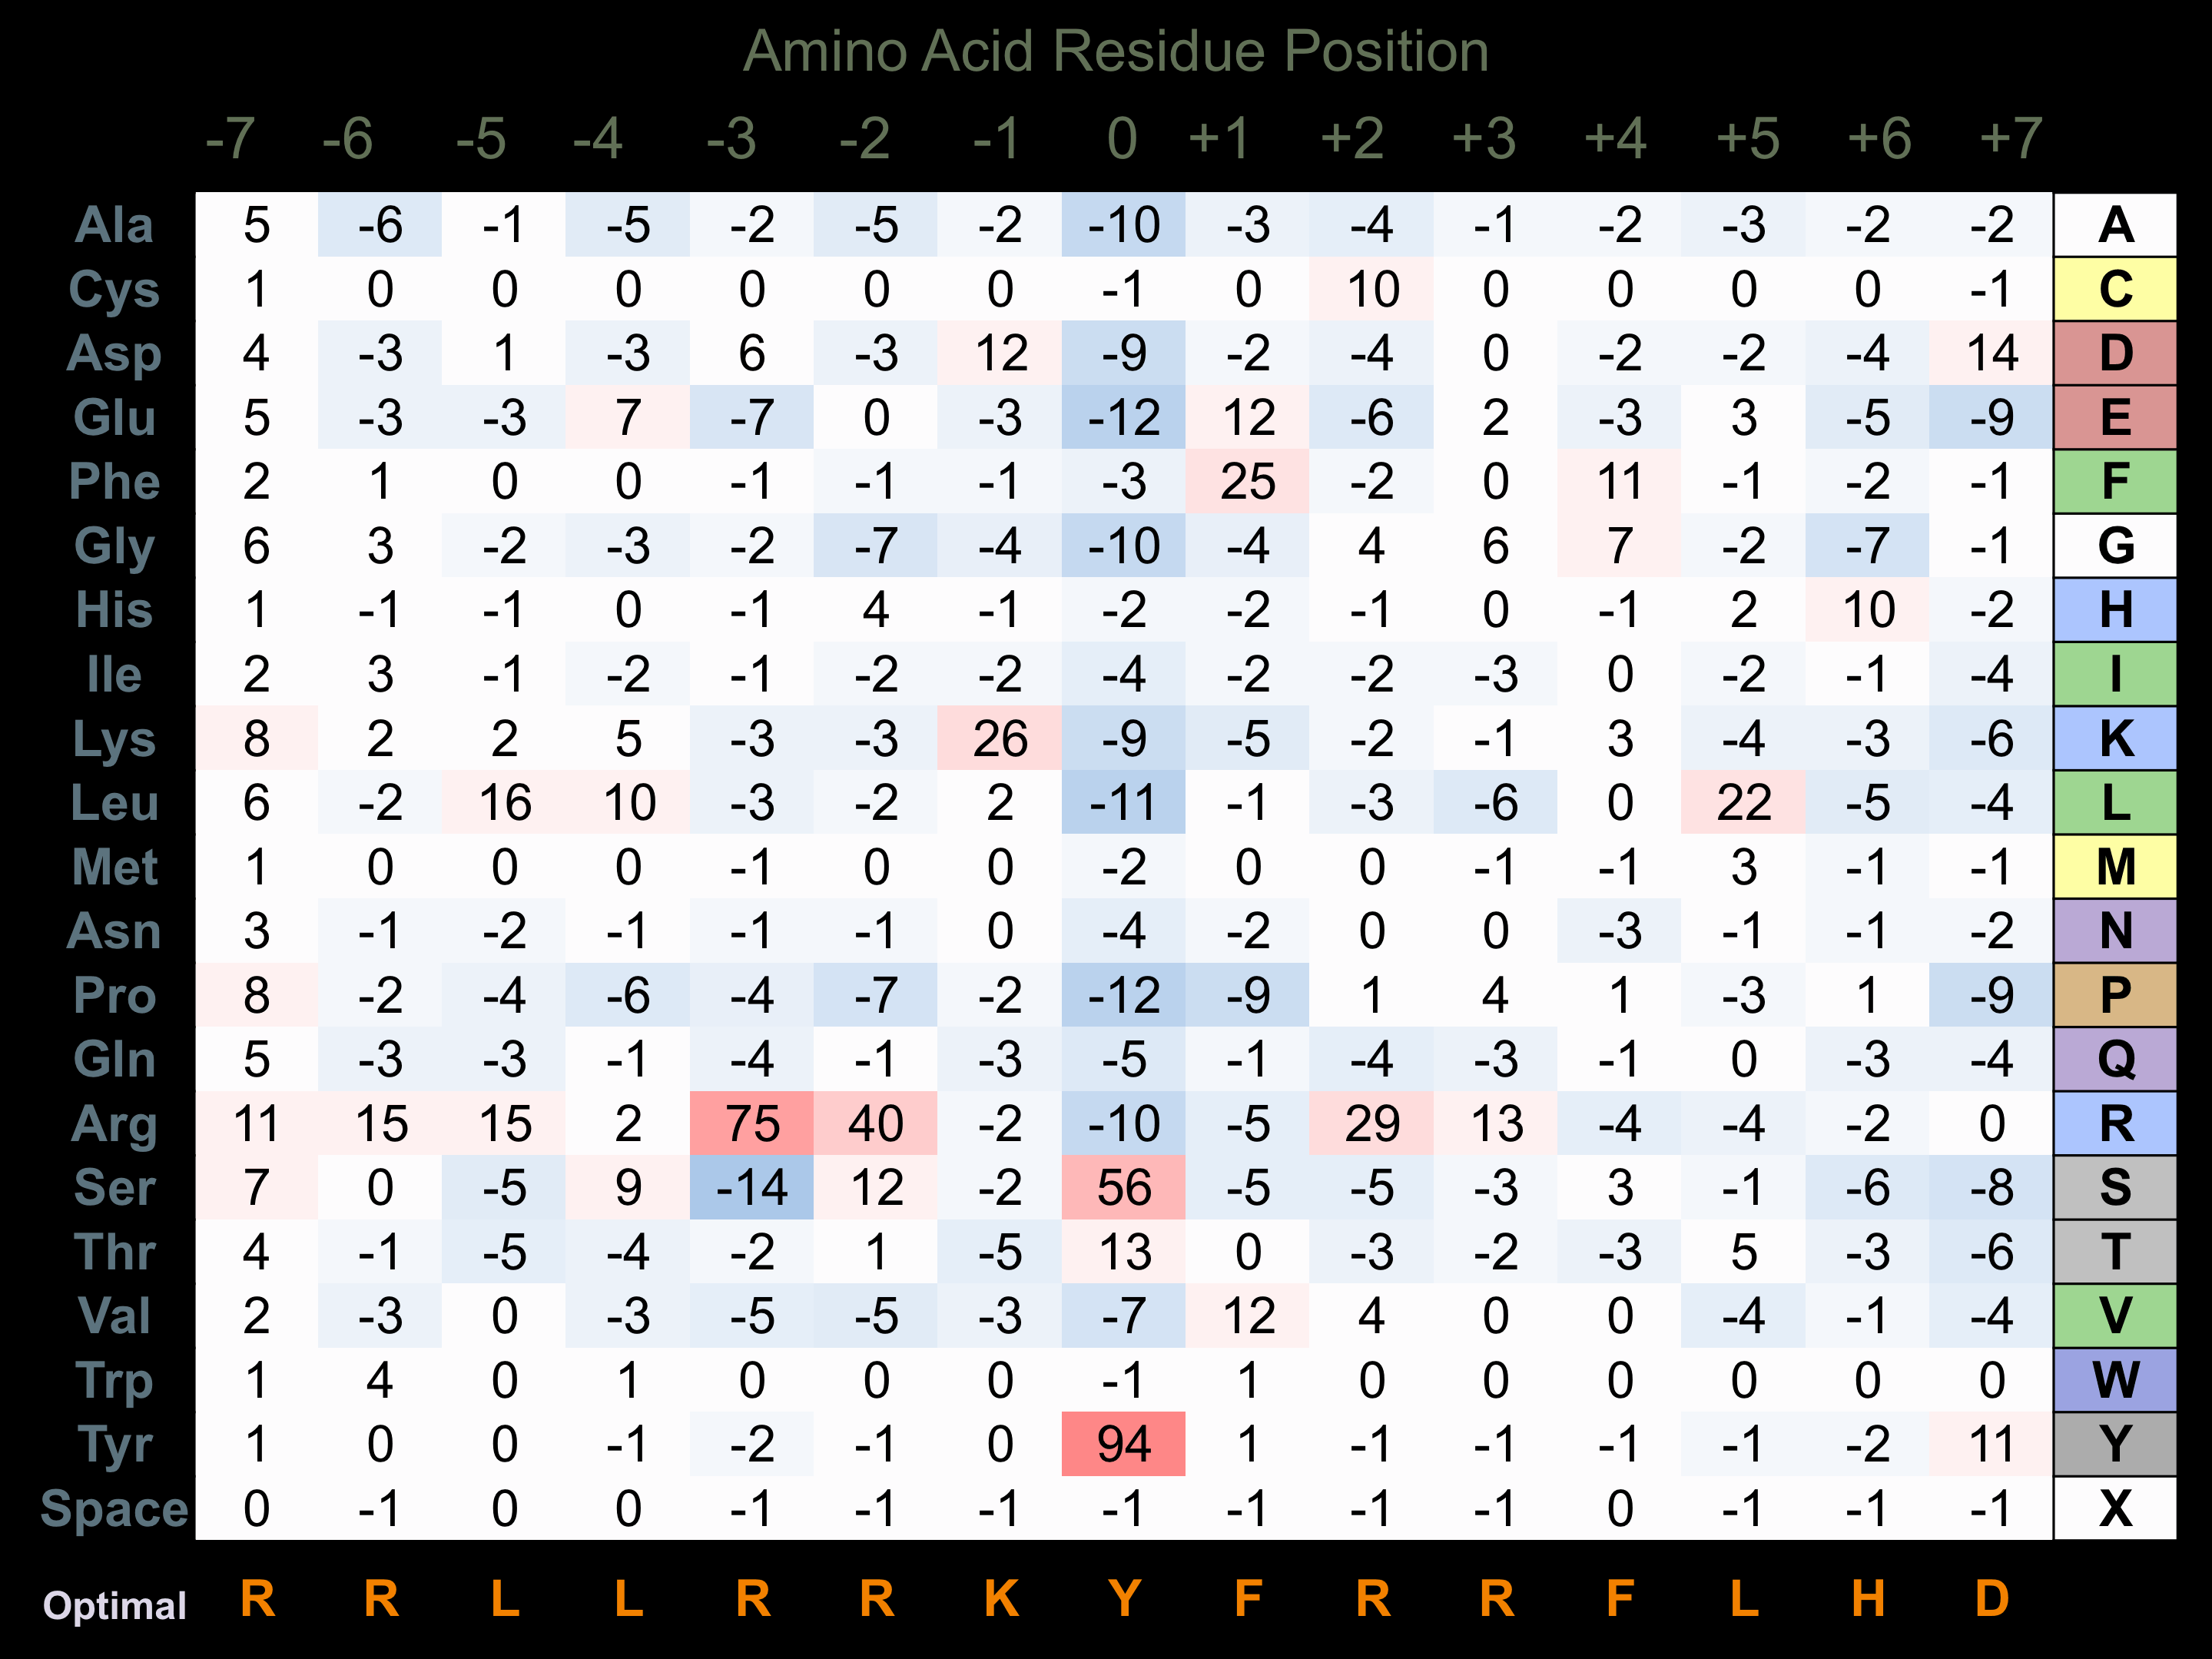
Matrix Type:
Predicted from the application of the Kinexus Kinase Substrate Predictor Version 2.0 algorithm, which was trained with over 10,000 kinase-protein substrate pairs and 8,000 kinase-peptide substrate pairs.
Domain #:
1
Disease Linkage
General Disease Association:
Neurological disorders
Specific Diseases (Non-cancerous):
Amyotrophic lateral sclerosis (ALS); Primary lateral sclerosis (PLS)
Comments:
Amyotrophic lateral sclerosis (ALS), commonly known as Lou Gehrig's disease, is a neurodegenerative disease characterized by a progressive loss of motor neurons leading to muscular and movement deficits. Initial symptoms include muscle twitching, cramping, stiffness, muscle weakness which progresses into slurred speech, difficulty chewing or swallowing (dysphagia), and eventually causes death due to respiratory failure within 2-10 years of onset. The majority of ALS patients have a sporadic form of the disease, compared to ~5-10% which have an inherited form of ALS. Four types of inherited ALS have been mapped to distinct loci in the human genome. One of those loci, chromosome 2q33-q35 has been associated with two forms of autosomal recessive juvenile ALS: ALS2 and ALS5. The STRADB gene has been mapped within the ALS2 critical region, indicating an involvment of this gene in the pathogenesis of the disease. The promoter for STRADB is close to, or overlaps with, the promoter for another gene mapped to this region, ALS2CR3 gene. STRADB is a pseudokinase which functions to enhance the anti-apoptotic activity of XIAP by increasing the XIAP-mediated activation of JNK1 and other related kinase, not through the regulation of XIAP-mediated caspase inhibition. Co-immunoprecipitation experiments have demonstrated an interaction between STRADB and TAK1 and TRaf6.
Gene Expression in Cancers:
TranscriptoNET (www.transcriptonet.ca) analysis with mRNA expression data retrieved from the National Center for Biotechnology Information's Gene Expression Omnibus (GEO) database, which was normalized against 60 abundantly and commonly found proteins, indicated altered expression for this protein kinase as shown here as the percent change from normal tissue controls (%CFC) as supported with the Student T-test in the following types of human cancers: Breast epithelial hyperplastic enlarged lobular units (HELU) (%CFC= +84, p<0.055); Colon mucosal cell adenomas (%CFC= -55, p<0.0001); Colorectal adenocarcinomas (early onset) (%CFC= -45, p<0.0002); Papillary thyroid carcinomas (PTC) (%CFC= +74, p<0.0009); and Prostate cancer (%CFC= +58, p<0.007). The COSMIC website notes an up-regulated expression score for STLK6 in diverse human cancers of 428, which is close to the average score of 462 for the human protein kinases. The down-regulated expression score of 6 for this protein kinase in human cancers was 0.1-fold of the average score of 60 for the human protein kinases.
Mutagenesis Experiments:
Insertional mutagenesis studies in mice have not yet revealed a role for this protein kinase in mouse cancer oncogenesis.
Mutation Rate in All Cancers:
Percent mutation rates per 100 amino acids length in human cancers: 0.06 % in 24914 diverse cancer specimens. This rate is only -14 % lower than the average rate of 0.075 % calculated for human protein kinases in general.
Mutation Rate in Specific Cancers:
Highest percent mutation rates per 100 amino acids length in human cancers: 0.37 % in 589 stomach cancers tested; 0.33 % in 864 skin cancers tested; 0.32 % in 1270 large intestine cancers tested; 0.26 % in 273 cervix cancers tested; 0.16 % in 603 endometrium cancers tested; 0.11 % in 441 autonomic ganglia cancers tested; 0.1 % in 710 oesophagus cancers tested; 0.09 % in 1634 lung cancers tested; 0.09 % in 1512 liver cancers tested; 0.04 % in 548 urinary tract cancers tested; 0.04 % in 1316 breast cancers tested; 0.03 % in 881 prostate cancers tested; 0.02 % in 1276 kidney cancers tested.
Frequency of Mutated Sites:
None > 9 in 20,197 cancer specimens
Comments:
No deletions, insertions or complex mutations are noted on the COSMIC website.