
Nomenclature
Short Name:
Fused
Full Name:
Serine-threonine kinase 36
Alias:
- EC 2.7.11.1
- FU
- Fused serine/threonine kinase
- KIAA1278
- Serine/threonine kinase 36, fused
- STK36
Classification
Type:
Protein-serine/threonine kinase
Group:
Other
Family:
ULK
SubFamily:
NA

Structure
Mol. Mass (Da):
143,995
# Amino Acids:
1315
# mRNA Isoforms:
2
mRNA Isoforms:
143,995 Da (1315 AA; Q9NRP7); 141,737 Da (1294 AA; Q9NRP7-2)
4D Structure:
NA
1D Structure:
Subfamily Alignment
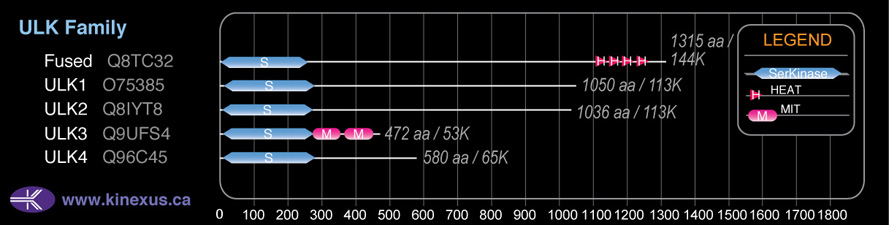
Domain Distribution:
Kinexus Products
Click on entries below for direct links to relevant products from Kinexus for this protein kinase.
hiddentext
Post-translation Modifications
For detailed information on phosphorylation of this kinase go to PhosphoNET
Acetylated:
K37.
Serine phosphorylated:
S26, S151, S159, S332, S578, S1293.
Threonine phosphorylated:
T321, T331, T581.
Tyrosine phosphorylated:
Y19, Y25, Y1181.
Ubiquitinated:
K363.
Distribution
Based on gene microarray analysis from the NCBI
Human Tissue Distribution
% Max Expression:
Mean Expression:
Number of Samples:
Standard Deviation:
% Max Expression:
Mean Expression:
Number of Samples:
Standard Deviation:
 37
37
1800
21
877
 18
18
884
8
1616
 -
-
-
-
-
 7
7
358
80
1013
 19
19
923
33
652
 0.6
0.6
28
27
14
 0.7
0.7
35
33
15
 100
100
4802
10
6877
 0.5
0.5
25
3
1
 7
7
316
79
750
 29
29
1378
7
2147
 22
22
1044
36
1037
 37
37
1774
2
459
 31
31
1483
5
2522
 23
23
1117
7
1705
 8
8
407
17
972
 9
9
429
78
511
 19
19
909
5
1214
 8
8
383
73
1496
 11
11
545
89
647
 22
22
1074
7
1529
 3
3
152
5
189
 -
-
-
-
-
 88
88
4216
7
4250
 20
20
982
7
1316
 23
23
1120
57
790
 28
28
1350
5
1882
 35
35
1701
5
2302
 32
32
1536
5
2085
 5
5
229
42
109
 35
35
1668
12
29
 2
2
94
23
92
 3
3
149
71
301
 19
19
936
78
782
 25
25
1205
48
3591
Evolution
Species Conservation
PhosphoNET % Identity:
PhosphoNET % Similarity:
Homologene %
Identity:
PhosphoNET % Identity:
PhosphoNET % Similarity:
Homologene %
Identity:
 100
100
100
100 0
0
0
99 96.5
96.5
98
97 -
-
-
88 -
-
-
92 87.9
87.9
92.7
88 -
-
-
- 81.9
81.9
87.1
85 85.3
85.3
91.3
85.5 -
-
-
- -
-
-
- 51.7
51.7
66.5
54 -
-
-
- 32.7
32.7
46.2
- -
-
-
- 25.1
25.1
38.4
- 27.5
27.5
41.5
- -
-
-
- 29.5
29.5
42
- -
-
-
- -
-
-
- -
-
-
33 26.9
26.9
43.6
- -
-
-
- -
-
-
-
For a wider analysis go to PhosphoNET Evolution in PhosphoNET
Regulation
Activation:
NA
Inhibition:
NA
Synthesis:
NA
Degradation:
NA
Protein Kinase Specificity
Matrix of observed frequency (%) of amino acids in aligned protein substrate phosphosites
Matrix Type:
Predicted from the application of the Kinexus Kinase Substrate Predictor Version 2.0 algorithm, which was trained with over 10,000 kinase-protein substrate pairs and 8,000 kinase-peptide substrate pairs.
Domain #:
1
Inhibitors
For further details on these inhibitors click on the Compound Name and enter it into DrugKiNET or click on the ID's
Based on in vitro and/or in vivo phosphorylation data
| Compound Name | KD, Ki or IC50 (nM) | PubChem ID | ChEMBL ID | PubMed ID |
|---|
Disease Linkage
General Disease Association:
Developmental disorders
Specific Diseases (Non-cancerous):
Syndactyly Type 1
Comments:
Syndactyly type 1 (SD1) is a development disease characterized by the malformation of the limbs, specifically the presence of partial or complete webbing between the third and fourth fingers and/or the second and third toes. The STK36 gene is located on chromosome 2q35 at 217.56 Mb, which is the same region that the SD1 disease maps to, indicating a potential link between STK36 activity and the disease phenotype. In patients with SD1, the STK36 coding region was observed to contain 3 different single nucleotide polymorphisms (SNPs) resulting in two alternative splicing events and the production of two protein isoforms that differed significantly in length. Therefore, the SNPs may be correlated with an increased risk for the development of SD1.
Gene Expression in Cancers:
TranscriptoNET (www.transcriptonet.ca) analysis with mRNA expression data retrieved from the National Center for Biotechnology Information's Gene Expression Omnibus (GEO) database, which was normalized against 60 abundantly and commonly found proteins, indicated altered expression for this protein kinase as shown here as the percent change from normal tissue controls (%CFC) as supported with the Student T-test in the following types of human cancers: Brain glioblastomas (%CFC= -97, p<0.08); Brain oligodendrogliomas (%CFC= -100, p<0.075); Breast epithelial carcinomas (%CFC= -50, p<0.088); Breast epithelial hyperplastic enlarged lobular units (HELU) (%CFC= +58, p<0.072); Ovary adenocarcinomas (%CFC= +79, p<0.0002); and Prostate cancer (%CFC= +52, p<(0.0003). The COSMIC website notes an up-regulated expression score for Fused in diverse human cancers of 392, which is 0.9-fold of the average score of 462 for the human protein kinases. The down-regulated expression score of 40 for this protein kinase in human cancers was 0.7-fold of the average score of 60 for the human protein kinases.
Mutagenesis Experiments:
Insertional mutagenesis studies in mice have not yet revealed a role for this protein kinase in mouse cancer oncogenesis.
Mutation Rate in All Cancers:
Percent mutation rates per 100 amino acids length in human cancers: 0.06 % in 24971 diverse cancer specimens. This rate is only -15 % lower than the average rate of 0.075 % calculated for human protein kinases in general.
Mutation Rate in Specific Cancers:
Highest percent mutation rates per 100 amino acids length in human cancers: 0.33 % in 864 skin cancers tested; 0.23 % in 1270 large intestine cancers tested; 0.17 % in 589 stomach cancers tested; 0.13 % in 238 bone cancers tested; 0.11 % in 603 endometrium cancers tested; 0.11 % in 1822 lung cancers tested; 0.08 % in 273 cervix cancers tested; 0.08 % in 1276 kidney cancers tested; 0.07 % in 834 ovary cancers tested; 0.07 % in 548 urinary tract cancers tested; 0.07 % in 441 autonomic ganglia cancers tested; 0.06 % in 942 upper aerodigestive tract cancers tested; 0.05 % in 1512 liver cancers tested; 0.04 % in 1459 pancreas cancers tested; 0.02 % in 2009 haematopoietic and lymphoid cancers tested.
Frequency of Mutated Sites:
Most frequent mutations with the number of reports indicated in brackets: Q103* (9).
Comments:
Only 3 deletions, no insertions or complex mutations are noted on the COSMIC website.