
Nomenclature
Short Name:
DRAK1
Full Name:
Death-associated protein kinase-related apoptosis inducing protein kinase 1
Alias:
- DAP kinase-related apoptosis-inducing protein kinase 1
- Death-associated protein kinase-related 1
- St17a
- ST17A
- Stk17a
- STK17A
- EC 2.7.11.1
- Kinase DRAK1
- Serine,threonine kinase 17A
- Serine/threonine kinase 17A
Classification
Type:
Protein-serine/threonine kinase
Group:
CAMK
Family:
DAPK
SubFamily:
NA

Structure
Mol. Mass (Da):
46,559
# Amino Acids:
414
# mRNA Isoforms:
1
mRNA Isoforms:
46,558 Da (414 AA; Q9UEE5)
4D Structure:
NA
1D Structure:
Subfamily Alignment
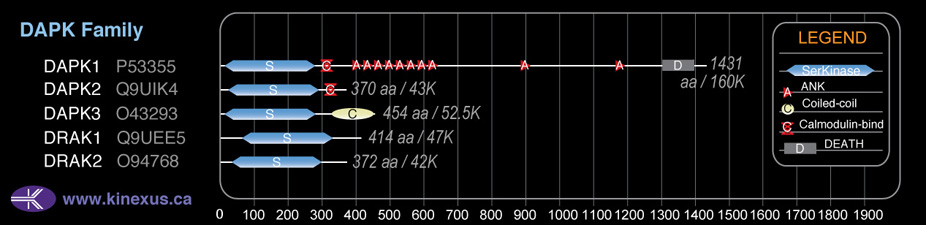
Domain Distribution:
| Start | End | Domain |
|---|---|---|
| 61 | 321 | Pkinase |
Post-translation Modifications
For detailed information on phosphorylation of this kinase go to PhosphoNET
Serine phosphorylated:
S9, S12, S13, S18, S28, S330, S348, S354.
Ubiquitinated:
K188.
Distribution
Based on gene microarray analysis from the NCBI
Human Tissue Distribution
% Max Expression:
Mean Expression:
Number of Samples:
Standard Deviation:
% Max Expression:
Mean Expression:
Number of Samples:
Standard Deviation:
 61
61
944
42
1101
 3
3
51
20
49
 18
18
277
5
288
 18
18
274
120
384
 41
41
642
36
606
 4
4
55
111
68
 20
20
313
47
492
 38
38
586
45
614
 28
28
430
24
370
 7
7
109
118
181
 7
7
112
36
232
 45
45
708
240
668
 26
26
401
38
1141
 3
3
46
18
52
 11
11
165
26
380
 4
4
65
22
53
 9
9
144
272
1429
 11
11
165
15
312
 4
4
70
119
133
 29
29
454
162
546
 6
6
97
24
180
 23
23
362
30
944
 36
36
561
8
903
 16
16
245
18
499
 20
20
309
26
757
 40
40
617
64
552
 21
21
335
41
753
 15
15
234
17
519
 8
8
124
17
220
 10
10
156
42
148
 35
35
547
30
369
 100
100
1559
51
2524
 9
9
137
91
263
 55
55
853
78
608
 25
25
396
48
572
Evolution
Species Conservation
PhosphoNET % Identity:
PhosphoNET % Similarity:
Homologene %
Identity:
PhosphoNET % Identity:
PhosphoNET % Similarity:
Homologene %
Identity:
 100
100
100
100 99.8
99.8
100
99.5 98.1
98.1
98.1
98 -
-
-
89 -
-
-
- 79.2
79.2
82.4
93 -
-
-
- 50
50
65
- 51.2
51.2
65.5
- -
-
-
- 72.7
72.7
79.2
- 74.9
74.9
83.1
79 64.8
64.8
78.4
67 65
65
77
74 -
-
-
- -
-
-
45 33.8
33.8
51.5
- -
-
-
- -
-
-
- -
-
-
- -
-
-
- -
-
-
- 25.9
25.9
41.1
- -
-
-
- -
-
-
-
For a wider analysis go to PhosphoNET Evolution in PhosphoNET
Regulation
Activation:
NA
Inhibition:
NA
Synthesis:
Directly regulated by p53/TP53: induced following cisplatin treatment in a p53/TP53-dependent manner.
Degradation:
NA
Known Downstream Substrates
For further details on these substrates click on the Substrate Short Name or UniProt ID. Phosphosite Location is hyperlinked to PhosphoNET
predictions.
Based on in vitro and/or in vivo phosphorylation data
| Substrate Short Name | UniProt ID (Human) | Phosphosite Location | Phosphosite Sequence | Effect of Phosphorylation |
|---|
Protein Kinase Specificity
Matrix of observed frequency (%) of amino acids in aligned protein substrate phosphosites
Matrix Type:
Predicted from the application of the Kinexus Kinase Substrate Predictor Version 2.0 algorithm, which was trained with over 10,000 kinase-protein substrate pairs and 8,000 kinase-peptide substrate pairs.
Domain #:
1
Inhibitors
For further details on these inhibitors click on the Compound Name and enter it into DrugKiNET or click on the ID's
Based on in vitro and/or in vivo phosphorylation data
| Compound Name | KD, Ki or IC50 (nM) | PubChem ID | ChEMBL ID | PubMed ID |
|---|
Disease Linkage
Gene Expression in Cancers:
TranscriptoNET (www.transcriptonet.ca) analysis with mRNA expression data retrieved from the National Center for Biotechnology Information's Gene Expression Omnibus (GEO) database, which was normalized against 60 abundantly and commonly found proteins, indicated altered expression for this protein kinase as shown here as the percent change from normal tissue controls (%CFC) as supported with the Student T-test in the following types of human cancers: Barrett's esophagus epithelial metaplasia (%CFC= +65, p<0.069); Pituitary adenomas (aldosterone-secreting) (%CFC= -45, p<0.076); T-cell prolymphocytic leukemia (%CFC= -55, p<0.056); and Vulvar intraepithelial neoplasia (%CFC= +112, p<0.062). The COSMIC website notes an up-regulated expression score for DRAK1 in diverse human cancers of 497, which is 1.1-fold of the average score of 462 for the human protein kinases. The down-regulated expression score of 3 for this protein kinase in human cancers was 0.1-fold of the average score of 60 for the human protein kinases.
Mutagenesis Experiments:
Insertional mutagenesis studies in mice have not yet revealed a role for this protein kinase in mouse cancer oncogenesis. K90A mutation can abrogate it catalytic activity and lead to loss of apoptotic function.
Mutation Rate in All Cancers:
Percent mutation rates per 100 amino acids length in human cancers: 0.06 % in 24727 diverse cancer specimens. This rate is only -22 % lower than the average rate of 0.075 % calculated for human protein kinases in general.
Mutation Rate in Specific Cancers:
Highest percent mutation rates per 100 amino acids length in human cancers: 0.28 % in 603 endometrium cancers tested; 0.25 % in 589 stomach cancers tested; 0.2 % in 864 skin cancers tested.
Frequency of Mutated Sites:
None > 3 in 20,010 cancer specimens
Comments:
Only 1 insertion and no deletionsor complex mutations are noted in COSMIC website