• KinATLAS
  • TranscriptoNET
  • PhosphoNET
  • OncoNET
  • KinaseNET
  • DrugKiNET
  • DrugProNET
  • KiNET-AM
  • Kinetica Online

Updated November 2019

Home | Kinexus | Contact | Credits

Nomenclature

Short Name:
RSK4
Full Name:
Ribosomal protein S6 kinase alpha 6
Alias:
  • EC 2.7.1.37
  • EC 2.7.11.1
  • Ribosomal protein S6 kinase, 90kDa, polypeptide 6
  • Ribosomal S6 kinase 4
  • RPS6KA6
  • S6K-alpha 6
  • KS6A6
  • P90-RSK 6
  • Pp90RSK4
  • Ribosomal protein S6 kinase alpha 6

Classification

Type:
Protein-serine/threonine kinase
Group:
AGC
Family:
RSK
SubFamily:
RSK


Specific Links

Entrez-Gene Entry: 27330
Entrez-Protein Entry: NP_055311
GeneCards Entry: RSK4
KinBASE Entry: RSK4
OMIM Entry: 300303
Pfam Entry: Q9UK32
PhosphoNET Entry: Q9UK32
Phosphosite Plus Entry: 2414
Source Entry: RPS6KA6
UCSD-Nature Entry: A002102
UniProt Entry: Q9UK32
Kinexus Products: RSK4
Ribosomal S6 protein-serine kinase 4 / Ribosomal protein S6 kinase alpha-6 (L678-R696, human) peptide - Powder PE-01BFF85T

General Links

ClustalW2
GPS-Cuckoo
Human Protein Atlas
Kinase.com
Kinase Research
Kinasource
Kinomer
Netphorest
NetworKIN
Phosida
PhosphoElm
Protein Blast
ScanSite
String

Structure

Mol. Mass (Da):
83,872
# Amino Acids:
745
# mRNA Isoforms:
2
mRNA Isoforms:
84,093 Da (745 AA; Q9UK32-2); 83,872 Da (745 AA; Q9UK32)
4D Structure:
Forms a complex with either ERK1 or ERK2 in quiescent cells. Transiently dissociates following mitogenic stimulation
1D Structure:
Retrieve Gene Sequence
Retrieve Full Protein Sequence
Retrieve Catalytic Domain Sequence
 
Subfamily Alignment
subfamily domain
 
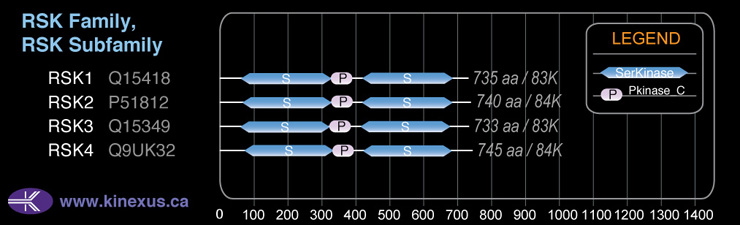
Domain Distribution:
Start End Domain
73 330 Pkinase
331 400 Pkinase_C
426 683 Pkinase
 

Kinexus Products

Click on entries below for direct links to relevant products from Kinexus for this protein kinase.
hiddentext
○ Ribosomal S6 protein-serine kinase 4 / Ribosomal protein S6 kinase alpha-6 (L678-R696, human) peptide - Powder PE-01BFF85T
 

Post-translation Modifications

For detailed information on phosphorylation of this kinase go to PhosphoNET
Acetylated:
K86, K105, K108, K348, K367, K386.
Serine phosphorylated:

S83-, S232+, S372+, S389+, S521, S547, S555, S730, S736.
Threonine phosphorylated:

T94, T236-, T482, T581+, T718.
Tyrosine phosphorylated:

Y149, Y231+, Y239-, Y437, Y474, Y525.
Ubiquitinated:
K86.
 

Distribution

Based on gene microarray analysis from the NCBI
Human Tissue Distribution
% Max Expression:

Mean Expression:

Number of Samples:

Standard Deviation:
% Max Expression:

Mean Expression:

Number of Samples:

Standard Deviation:
  • adipose
    100

    654

    44

    995

  • adrenal
    9

    60

    15

    112

  • bladder
    5

    35

    13

    62

  • brain
    22

    141

    146

    300

  • breast
    70

    457

    44

    386

  • cervix
    2

    11

    92

    11

  • colon
    4

    29

    47

    26

  • heart
    55

    361

    46

    563

  • intestine
    36

    234

    17

    187

  • kidney
    8

    50

    135

    54

  • liver
    4

    24

    41

    46

  • lung
    95

    621

    158

    548

  • lymphnode
    4

    25

    45

    51

  • ovary
    5

    30

    9

    42

  • pancreas
    4

    25

    17

    33

  • pituitary
    2

    15

    24

    18

  • prostate
    3

    18

    283

    20

  • salivarygland
    5

    33

    30

    49

  • skeletalmuscle"
    6

    42

    129

    53

  • skin
    55

    359

    165

    334

  • spinalcord
    4

    25

    36

    44

  • spleen
    3

    20

    36

    45

  • stomach
    3

    21

    26

    35

  • testis
    5

    31

    31

    60

  • thymus
    4

    24

    36

    60

  • thyroid
    81

    530

    98

    552

  • tonsil
    3

    21

    45

    44

  • trachea
    5

    32

    30

    55

  • uterus
    4

    24

    31

    45

  • reticulocytes"
    15

    97

    56

    132

  • t-lymphocytes
    35

    232

    24

    222

  • b-lymphocytes
    57

    375

    46

    451

  • neutrophils
    26

    171

    115

    433

  • macrophages
    94

    614

    104

    555

  • sperm
    8

    52

    61

    44


Evolution

Species Conservation
PhosphoNET % Identity:
PhosphoNET % Similarity:
Homologene %
Identity:
PhosphoNET % Identity:
PhosphoNET % Similarity:
Homologene %
Identity:
  • tableheader
    100

    100

    100
  • tableheader
    0

    0

    98
  • tableheader
    99.3

    99.4

    99
  • tableheader
    -

    -

    96
  • tableheader
    -

    -

    -
  • tableheader
    94.7

    97.8

    95
  • tableheader
    -

    -

    -
  • tableheader
    85.3

    90.9

    88.5
  • tableheader
    72.8

    83.7

    89
  • tableheader
    -

    -

    -
  • tableheader
    80.5

    87

    -
  • tableheader
    74.4

    84

    88
  • tableheader
    71.6

    81.7

    87
  • tableheader
    83.8

    90.4

    85
  • tableheader
    -

    -

    -
  • tableheader
    24.4

    35.9

    -
  • tableheader
    -

    -

    -
  • tableheader
    55

    69.3

    -
  • tableheader
    -

    -

    -
  • tableheader
    -

    -

    -
  • tableheader
    -

    -

    -
  • tableheader
    -

    -

    -
  • tableheader
    -

    -

    -
  • tableheader
    -

    -

    -
  • tableheader
    -

    -

    -
For a wider analysis go to PhosphoNET Evolution in PhosphoNET
 

Binding Proteins

Examples of known interacting proteins
hiddentext
No. Name – UniProt ID
1 NR4A1 - P22736
 

Regulation

Activation:
Activated by multiple phosphorylations on threonine and serine residues.
Inhibition:
NA
Synthesis:
NA
Degradation:
NA
 

Protein Kinase Specificity

Matrix of observed frequency (%) of amino acids in aligned protein substrate phosphosites

Kinections GIF
Matrix Type:
Predicted from the application of the Kinexus Kinase Substrate Predictor Version 2.0 algorithm, which was trained with over 10,000 kinase-protein substrate pairs and 8,000 kinase-peptide substrate pairs.
Domain #:
2
 

Inhibitors

For further details on these inhibitors click on the Compound Name and enter it into DrugKiNET or click on the ID's
Based on in vitro and/or in vivo phosphorylation data
Compound Name KD, Ki or IC50 (nM) PubChem ID ChEMBL ID PubMed ID
Staurosporine IC50 = 5 nM 5279
Hesperadin Kd < 10 nM 10142586 514409 19035792
Bisindolylmaleimide I IC50 < 25 nM 2396 7463 22037377
Cdk1/2 Inhibitor III IC50 < 25 nM 5330812 261720 22037377
Enzastaurin Kd = 25 nM 176167 300138 22037378
Gö6976 IC50 < 25 nM 3501 302449 22037377
K-252a; Nocardiopsis sp. IC50 < 25 nM 3813 281948 22037377
PKCb Inhibitor IC50 < 25 nM 6419755 366266 22037377
Ro-32-0432 IC50 < 25 nM 127757 26501 22037377
SB218078 IC50 < 25 nM 447446 289422 22037377
NVP-TAE684 Kd = 27 nM 16038120 509032 22037378
AT9283 IC50 < 30 nM 24905142 19143567
Alsterpaullone; 2-Cyanoethyl IC50 > 50 nM 16760286 260138 22037377
Gö6983 IC50 > 50 nM 3499 261491 22037377
JAK3 Inhibitor VI IC50 > 50 nM 16760524 22037377
PKR Inhibitor IC50 > 50 nM 6490494 235641 22037377
SU11652 IC50 > 50 nM 24906267 13485 22037377
Syk Inhibitor IC50 > 50 nM 6419747 104279 22037377
CHEMBL435809 IC50 = 100 nM 44352842 435809
Lestaurtinib Kd = 110 nM 126565 19654408
Bisindolylmaleimide IV IC50 > 150 nM 2399 266487 22037377
Dovitinib IC50 > 150 nM 57336746 22037377
Flt-3 Inhibitor II IC50 > 150 nM 11601743 377193 22037377
IDR E804 IC50 > 150 nM 6419764 1802727 22037377
JNJ-7706621 IC50 > 150 nM 5330790 191003 22037377
Ruxolitinib Kd = 150 nM 25126798 1789941 22037378
Sunitinib IC50 > 150 nM 5329102 535 22037377
Nintedanib Kd = 230 nM 9809715 502835 22037378
Vandetanib Kd = 240 nM 3081361 24828 18183025
AG-E-60384 IC50 > 250 nM 6419741 413188 22037377
Alsterpaullone IC50 > 250 nM 5005498 50894 22037377
ALX-270-403-M001 IC50 > 250 nM 22037377
BCP9000906 IC50 > 250 nM 5494425 21156 22037377
GSK-3 Inhibitor IX IC50 > 250 nM 5287844 409450 22037377
IKK-2 Inhibitor IV IC50 > 250 nM 9903786 257167 22037377
SB203580 Kd = 250 nM 176155 10 18183025
Semaxinib IC50 > 250 nM 5329098 276711 22037377
SureCN2579964 IC50 < 250 nM 290221 233000 22934575
SB202190 Kd = 270 nM 5353940 278041 18183025
GSK461364A Kd = 350 nM 15983966 1908394 22037378
TG101348 Kd = 360 nM 16722836 1287853 22037378
KW2449 Kd = 440 nM 11427553 1908397 22037378
Aloisine A IC50 = 500 nM 5326843 75680 22037377
Indirubin-3′-monoxime IC50 = 500 nM 5326739 22037377
N-Benzoylstaurosporine IC50 = 500 nM 56603681 608533 22037377
NU6140 IC50 = 500 nM 10202471 1802728 22037377
SU9516 IC50 = 500 nM 5289419 258805 22037377
Tofacitinib Kd = 540 nM 9926791 221959 22037378
Alvocidib Kd = 800 nM 9910986 428690 18183025
TG100115 Kd = 970 nM 10427712 230011 22037378
BIX02188 IC50 = 990 nM 23507698 18834865
A 443654 IC50 < 1 µM 10172943 379300 19465931
BML-277 IC50 > 1 µM 9969021 179583 22037377
Bosutinib IC50 > 1 µM 5328940 288441 22037377
CHEMBL566515 Kd < 1 µM 44478401 566515 19788238
GSK-3 Inhibitor XIII IC50 > 1 µM 6419766 359482 22037377
MK5108 IC50 > 1 µM 24748204 20053775
PDK1/Akt/Flt Dual Pathway Inhibitor IC50 > 1 µM 5113385 599894 22037377
SU11274 IC50 > 1 µM 9549297 261641 22037377
SU6656 IC50 > 1 µM 5353978 605003 22037377
WHI-P154 IC50 > 1 µM 3795 473773 22037377
WZ3146 Kd > 1 µM 44607360 20033049
WZ4002 Kd > 1 µM 44607530 20033049
BI2536 Kd = 1.3 µM 11364421 513909 22037378
Ruboxistaurin Kd = 2.3 µM 153999 91829 18183025
GSK1838705A Kd = 3 µM 25182616 464552 22037378
Afatinib Kd = 3.1 µM 10184653 1173655 22037378
SU14813 Kd = 3.1 µM 10138259 1721885 18183025
BIX02188 IC50 = 3.2 µM 23507698 18834865
AST-487 Kd = 3.4 µM 11409972 574738 22037378
SureCN2505235 IC50 < 4 µM 23649240 22934575
BMS-690514 Kd < 4.5 µM 11349170 21531814
 

Disease Linkage

General Disease Association:

Cancer, neurological, eye, and ear disorders
Specific Diseases (Non-cancerous):

Coffin-Lowry syndrome (CLS); Choroideremia (CHM); X-linked nonsyndromic deafness
Specific Cancer Types:
Breast cancer; Kidney cancer
Comments:
The RSK4 gene is frequently found epigenetically inactivated by promoter methylation in cancerous and non-cancerous tissues of breast cancer. It is also a prognostic factor for renal cell carcinoma.
 
Gene Expression in Cancers:

TranscriptoNET (www.transcriptonet.ca) analysis with mRNA expression data retrieved from the National Center for Biotechnology Information's Gene Expression Omnibus (GEO) database, which was normalized against 60 abundantly and commonly found proteins, indicated altered expression for this protein kinase as shown here as the percent change from normal tissue controls (%CFC) as supported with the Student T-test in the following types of human cancers: Bladder carcinomas (%CFC= -50, p<0.0001); and Papillary thyroid carcinomas (PTC) (%CFC= -62, p<0.002). The COSMIC website notes an up-regulated expression score for RSK4 in diverse human cancers of 630, which is 1.4-fold of the average score of 462 for the human protein kinases. The down-regulated expression score of 8 for this protein kinase in human cancers was 0.1-fold of the average score of 60 for the human protein kinases.
Mutagenesis Experiments:

Insertional mutagenesis studies in mice have not yet revealed a role for this protein kinase in mouse cancer oncogenesis.
Mutation Rate in All Cancers:

Percent mutation rates per 100 amino acids length in human cancers: 0.11 % in 24990 diverse cancer specimens. This rate is a modest 1.51-fold higher than the average rate of 0.075 % calculated for human protein kinases in general.
Mutation Rate in Specific Cancers:

Highest percent mutation rates per 100 amino acids length in human cancers: 0.7 % in 805 skin cancers tested; 0.49 % in 1093 large intestine cancers tested; 0.42 % in 602 endometrium cancers tested; 0.3 % in 589 stomach cancers tested; 0.29 % in 605 oesophagus cancers tested; 0.22 % in 1858 lung cancers tested.
Frequency of Mutated Sites:

None > 5 in 20,274 cancer specimens
Comments:
Eight deletions (7 at A110fs*3), 3 insertion mutations (1 at A110fs*36), and no complex mutations are noted on the COSMIC website.
 
COSMIC Entry:
RPS6KA6
OMIM Entry:
300303
  • Home
  • Top of Page
Copyright 2019 Kinexus BioInformatics Corporation