
Nomenclature
Short Name:
ZC2
Full Name:
TRAF2 and NCK-interacting kinase
Alias:
- EC 2.7.11.1
- KIAA0551
- TNIK
- TRAF2 and NCK interacting kinase
Classification
Type:
Protein-serine/threonine kinase
Group:
STE
Family:
STE20
SubFamily:
MSN

Structure
Mol. Mass (Da):
154,943
# Amino Acids:
1360
# mRNA Isoforms:
8
mRNA Isoforms:
154,943 Da (1360 AA; Q9UKE5); 154,008 Da (1352 AA; Q9UKE5-4); 151,300 Da (1331 AA; Q9UKE5-2); 150,365 Da (1323 AA; Q9UKE5-6); 148,829 Da (1305 AA; Q9UKE5-3); 147,894 Da (1297 AA; Q9UKE5-7); 145,186 Da (1276 AA; Q9UKE5-5); 144,251 Da (1268 AA; Q9UKE5-8)
4D Structure:
Interacts with RAP2A, TRAF2 and NCK. Interacts with TCF7L2/TCF4 and CTNNB1; the interaction is direct
1D Structure:
3D Image (rendered using PV Viewer):
PDB ID
Subfamily Alignment
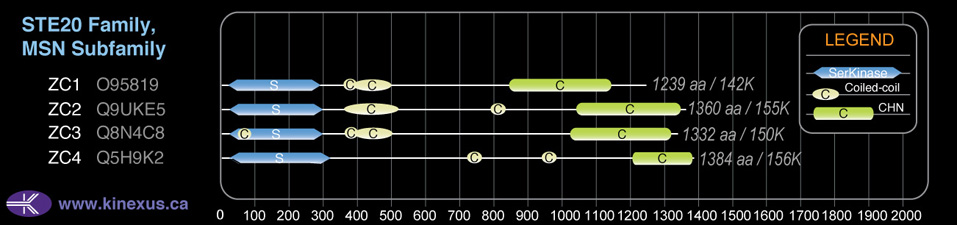
Domain Distribution:
| Start | End | Domain |
|---|---|---|
| 25 | 289 | Pkinase |
| 366 | 506 | Coiled-coil |
| 797 | 817 | Coiled-coil |
| 1047 | 1334 | CNH |
Kinexus Products
Click on entries below for direct links to relevant products from Kinexus for this protein kinase.
hiddentext
Post-translation Modifications
For detailed information on phosphorylation of this kinase go to PhosphoNET
Acetylated:
K824.
Serine phosphorylated:
S16, S175, S324, S326, S335, S526, S548, S560, S570, S574, S600, S608, S610, S640, S678, S680, S688, S701, S707, S720, S726, S729, S730, S731, S755, S764, S766, S769, S795, S938, S959, S996, S997, S1116.
Threonine phosphorylated:
T181, T187+, T319, T581, T643, T677, T725, T902, T987, T1003, T1036, T1267.
Tyrosine phosphorylated:
Y36, Y40, Y86, Y321, Y323, Y427, Y446, Y475, Y499, Y519, Y521, Y963, Y982-, Y1264.
Ubiquitinated:
K121, K1131, K1319.
Distribution
Based on gene microarray analysis from the NCBI
Human Tissue Distribution
% Max Expression:
Mean Expression:
Number of Samples:
Standard Deviation:
% Max Expression:
Mean Expression:
Number of Samples:
Standard Deviation:
 92
92
1016
48
1101
 15
15
168
23
302
 6
6
61
3
21
 39
39
432
143
466
 56
56
616
45
512
 65
65
721
128
2900
 17
17
187
53
402
 100
100
1109
43
1672
 79
79
873
24
610
 16
16
172
127
364
 8
8
92
30
104
 75
75
836
210
664
 6
6
72
40
67
 20
20
224
17
458
 11
11
126
21
206
 9
9
99
31
161
 4
4
48
127
53
 13
13
146
16
255
 21
21
230
133
662
 30
30
332
194
418
 19
19
215
20
180
 6
6
70
20
36
 7
7
75
6
25
 26
26
283
22
389
 9
9
95
20
127
 82
82
905
84
1470
 7
7
73
43
113
 13
13
140
16
197
 13
13
144
16
202
 10
10
110
56
88
 59
59
652
30
636
 46
46
515
54
513
 22
22
239
97
602
 87
87
968
104
651
 28
28
316
61
351
Evolution
Species Conservation
PhosphoNET % Identity:
PhosphoNET % Similarity:
Homologene %
Identity:
PhosphoNET % Identity:
PhosphoNET % Similarity:
Homologene %
Identity:
 100
100
100
100 99.9
99.9
99.9
100 99.8
99.8
99.9
100 -
-
-
99 -
-
-
- 95.2
95.2
95.7
99 -
-
-
- 96.1
96.1
96.9
99 24.9
24.9
38.6
- -
-
-
- -
-
-
- 94.8
94.8
96.8
96 -
-
-
89 -
-
-
82 -
-
-
- -
-
-
- -
-
-
- 45.4
45.4
59.1
- -
-
-
- -
-
-
- -
-
-
- -
-
-
- -
-
-
- -
-
-
- -
-
-
-
For a wider analysis go to PhosphoNET Evolution in PhosphoNET
Binding Proteins
Examples of known interacting proteins
hiddentext
| No. | Name – UniProt ID |
|---|---|
| 1 | NCK1 - P16333 |
| 2 | SLC9A1 - P19634 |
| 3 | RAP2A - P10114 |
| 4 | TRAF2 - Q12933 |
| 5 | GSN - P06396 |
| 6 | MYT1L - Q9UL68 |
| 7 | SPTBN1 - Q01082 |
| 8 | CLU - P10909 |
| 9 | TRIM2 - Q9C040 |
| 10 | ANK2 - Q01484 |
| 11 | PPP1R13B - Q96KQ4 |
| 12 | WWC1 - Q8IX03 |
| 13 | NCOR2 - Q9Y618 |
| 14 | PDE4DIP - Q5VU43 |
| 15 | CNKSR2 - Q8WXI2 |
Regulation
Activation:
NA
Inhibition:
NA
Synthesis:
NA
Degradation:
NA
Protein Kinase Specificity
Matrix of observed frequency (%) of amino acids in aligned protein substrate phosphosites
Matrix Type:
Predicted from the application of the Kinexus Kinase Substrate Predictor Version 2.0 algorithm, which was trained with over 10,000 kinase-protein substrate pairs and 8,000 kinase-peptide substrate pairs.
Domain #:
1
Inhibitors
For further details on these inhibitors click on the Compound Name and enter it into DrugKiNET or click on the ID's
Based on in vitro and/or in vivo phosphorylation data
| Compound Name | KD, Ki or IC50 (nM) | PubChem ID | ChEMBL ID | PubMed ID |
|---|
Disease Linkage
Gene Expression in Cancers:
TranscriptoNET (www.transcriptonet.ca) analysis with mRNA expression data retrieved from the National Center for Biotechnology Information's Gene Expression Omnibus (GEO) database, which was normalized against 60 abundantly and commonly found proteins, indicated altered expression for this protein kinase as shown here as the percent change from normal tissue controls (%CFC) as supported with the Student T-test in the following types of human cancers: Barrett's esophagus epithelial metaplasia (%CFC= +99, p<0.0006); Clear cell renal cell carcinomas (cRCC) stage I (%CFC= -53, p<0.0001); Oral squamous cell carcinomas (OSCC) (%CFC= +92, p<0.021); Papillary thyroid carcinomas (PTC) (%CFC= +99, p<0.038); Pituitary adenomas (aldosterone-secreting) (%CFC= +48, p<0.052); and T-cell prolymphocytic leukemia (%CFC= -45, p<0.001). The COSMIC website notes an up-regulated expression score for ZC2 in diverse human cancers of 501, which is 1.1-fold of the average score of 462 for the human protein kinases. The down-regulated expression score of 1 for this protein kinase in human cancers was 98% lower than average score of 60 for the human protein kinases.
Mutagenesis Experiments:
Insertional mutagenesis studies in mice support a role for this protein kinase in mouse cancer oncogenesis. Mutations at the 54, 152-153 and 171-172 amino acid residue positions of ZC2 can lead to loss of autophosphorylation.
Mutation Rate in All Cancers:
Percent mutation rates per 100 amino acids length in human cancers: 0.08 % in 24939 diverse cancer specimens. This rate is very similar (+ 9% higher) to the average rate of 0.075 % calculated for human protein kinases in general.
Mutation Rate in Specific Cancers:
Highest percent mutation rates per 100 amino acids length in human cancers: 0.47 % in 864 skin cancers tested; 0.31 % in 1270 large intestine cancers tested; 0.28 % in 603 endometrium cancers tested; 0.22 % in 273 cervix cancers tested; 0.15 % in 589 stomach cancers tested; 0.13 % in 1822 lung cancers tested; 0.08 % in 710 oesophagus cancers tested; 0.08 % in 1276 kidney cancers tested; 0.07 % in 833 ovary cancers tested; 0.07 % in 1316 breast cancers tested; 0.06 % in 1512 liver cancers tested; 0.06 % in 127 biliary tract cancers tested; 0.05 % in 881 prostate cancers tested; 0.04 % in 548 urinary tract cancers tested; 0.04 % in 2009 haematopoietic and lymphoid cancers tested; 0.04 % in 1459 pancreas cancers tested; 0.02 % in 942 upper aerodigestive tract cancers tested; 0.02 % in 441 autonomic ganglia cancers tested; 0.01 % in 558 thyroid cancers tested; 0.01 % in 2082 central nervous system cancers tested.
Frequency of Mutated Sites:
Most frequent mutations with the number of reports indicated in brackets: R761* (4); R1031W (4); R761Q (2); E1005K (3); S1021L (3).
Comments:
Only 9 deletions, 1 insertion, and no complex mutations are noted on the COSMIC website.