
Nomenclature
Short Name:
TAO2
Full Name:
Serine-threonine-protein kinase TAO2
Alias:
- EC 2.7.11.1
- KIAA0881
- PSK-1
- Serine/threonine-protein kinase TAO2
- TAO kinase 2
- TAOK2
- MAP3K17
- Prostate-derived STE20-like kinase 1
- PSK
- PSK1
Classification
Type:
Protein-serine/threonine kinase
Group:
STE
Family:
STE20
SubFamily:
TAO

Structure
Mol. Mass (Da):
138251
# Amino Acids:
1235
# mRNA Isoforms:
4
mRNA Isoforms:
138,251 Da (1235 AA; Q9UL54); 126,204 Da (1122 AA; Q9UL54-4); 119,281 Da (1049 AA; Q9UL54-2); 118,780 Da (1062 AA; Q9UL54-3)
4D Structure:
Interacts with MKK3 and MKK6 By similarity. Self-associates. Interacts with tubulins through the C-terminal domain. Interacts with MAP3K7 and interfers with MAP3K7-binding to IKKA and thus prevents NF-kappa-B activation
1D Structure:
Subfamily Alignment
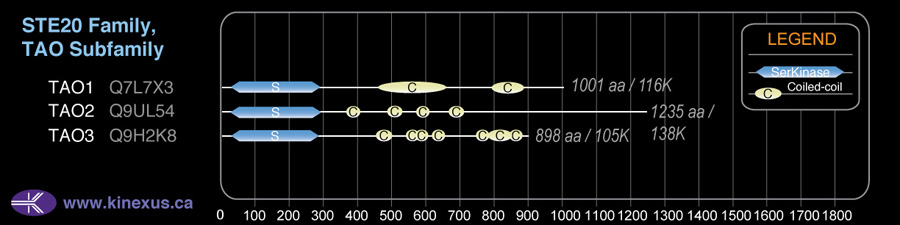
Domain Distribution:
| Start | End | Domain |
|---|---|---|
| 28 | 281 | Pkinase |
| 368 | 392 | Coiled-coil |
| 492 | 519 | Coiled-coil |
| 577 | 600 | Coiled-coil |
| 681 | 701 | Coiled-coil |
Kinexus Products
Click on entries below for direct links to relevant products from Kinexus for this protein kinase.
hiddentext
Post-translation Modifications
For detailed information on phosphorylation of this kinase go to PhosphoNET
Acetylated:
K64, K69.
Methylated:
R1126, R1133.
Serine phosphorylated:
S9, S29, S38, S181+, S347, S414, S437, S452, S473, S486, S603, S656, S777, S825, S827.
Threonine phosphorylated:
T344, T450, T468, T604.
Tyrosine phosphorylated:
Y43, Y61, Y107, Y309, Y338, Y426, Y430.
Ubiquitinated:
K153.
Distribution
Based on gene microarray analysis from the NCBI
Human Tissue Distribution
% Max Expression:
Mean Expression:
Number of Samples:
Standard Deviation:
% Max Expression:
Mean Expression:
Number of Samples:
Standard Deviation:
 88
88
878
45
1049
 9
9
90
23
84
 5
5
50
3
48
 35
35
345
121
508
 65
65
651
39
584
 2
2
24
111
15
 19
19
186
46
522
 68
68
682
42
687
 34
34
336
27
277
 15
15
145
106
253
 8
8
82
33
107
 74
74
742
227
617
 4
4
43
36
24
 6
6
56
18
67
 11
11
107
24
142
 8
8
81
22
48
 27
27
270
183
271
 6
6
62
16
60
 7
7
65
114
53
 39
39
394
165
425
 17
17
165
21
144
 13
13
127
27
147
 6
6
57
6
59
 9
9
88
17
88
 13
13
130
21
166
 73
73
733
66
1132
 4
4
43
42
25
 6
6
56
17
50
 6
6
62
17
49
 19
19
188
42
140
 69
69
693
42
581
 100
100
1000
51
1441
 6
6
63
84
186
 75
75
745
78
627
 8
8
75
57
85
Evolution
Species Conservation
PhosphoNET % Identity:
PhosphoNET % Similarity:
Homologene %
Identity:
PhosphoNET % Identity:
PhosphoNET % Similarity:
Homologene %
Identity:
 100
100
100
100 82.1
82.1
82.3
0 98.5
98.5
99.1
100 -
-
-
99 -
-
-
94 96.1
96.1
97.6
98 -
-
-
- 67.6
67.6
71.8
98 92.3
92.3
95.1
92 -
-
-
- 63.5
63.5
68.2
- 44.4
44.4
56.7
- 56.1
56.1
65.6
83 53.1
53.1
63.2
79 -
-
-
- -
-
-
- -
-
-
- 27.8
27.8
44.9
- -
-
-
- -
-
-
- -
-
-
- -
-
-
- -
-
-
- -
-
-
- -
-
-
-
For a wider analysis go to PhosphoNET Evolution in PhosphoNET
Binding Proteins
Examples of known interacting proteins
hiddentext
| No. | Name – UniProt ID |
|---|---|
| 1 | MAP2K3 - P46734 |
| 2 | MAP2K6 - P52564 |
| 3 | ELK1 - P19419 |
| 4 | TUBA4A - P68366 |
| 5 | TUBB2A - Q13885 |
| 6 | MEGF10 - Q96KG7 |
| 7 | GRB2 - P62993 |
Regulation
Activation:
NA
Inhibition:
NA
Synthesis:
NA
Degradation:
NA
Protein Kinase Specificity
Matrix of observed frequency (%) of amino acids in aligned protein substrate phosphosites
Matrix Type:
Derived from alignment of 32 peptides phosphorylated by recombinant TAO2 in vitro tested in-house by Kinexus.
Domain #:
1
Inhibitors
For further details on these inhibitors click on the Compound Name and enter it into DrugKiNET or click on the ID's
Based on in vitro and/or in vivo phosphorylation data
| Compound Name | KD, Ki or IC50 (nM) | PubChem ID | ChEMBL ID | PubMed ID |
|---|
Disease Linkage
Gene Expression in Cancers:
TranscriptoNET (www.transcriptonet.ca) analysis with mRNA expression data retrieved from the National Center for Biotechnology Information's Gene Expression Omnibus (GEO) database, which was normalized against 60 abundantly and commonly found proteins, indicated altered expression for this protein kinase as shown here as the percent change from normal tissue controls (%CFC) as supported with the Student T-test in the following types of human cancers: Breast epithelial carcinomas (%CFC= +67, p<0.053); and Prostate cancer - primary (%CFC= +87, p<0.0001).
Mutagenesis Experiments:
Insertional mutagenesis studies in mice have not yet revealed a role for this protein kinase in mouse cancer oncogenesis. A K57A mutation can inhibit TAO2 phosphotransferase activity. With this K57A mutation, the isoform 1 protein would be prevented from entering the nucleus. Isoform 1 has been associated with the apoptotic pathway involving membrane blebbing, shrinkage of the cell, and formation of apoptotic bodies. Isoform 1 has been observed to bind microtubules, affecting stability and organization. TAO2 phosphotransferase activity can also be lost with a D169A mutation, yet this will not modulate the ability of the protein to activate NF-kappa-B. Nuclear localization is inhibited with, and apoptosis induced with a D919N mutation. No change in TAO2 phosphotransferase activity seems to occur with the D919N mutation.
Mutation Rate in All Cancers:
Percent mutation rates per 100 amino acids length in human cancers: 0.07 % in 24434 diverse cancer specimens. This rate is only -12 % lower than the average rate of 0.075 % calculated for human protein kinases in general.
Mutation Rate in Specific Cancers:
Highest percent mutation rates per 100 amino acids length in human cancers: 0.54 % in 15 pituitary cancers tested; 0.29 % in 589 stomach cancers tested; 0.24 % in 864 skin cancers tested; 0.19 % in 1270 large intestine cancers tested; 0.16 % in 603 endometrium cancers tested; 0.15 % in 273 cervix cancers tested; 0.12 % in 548 urinary tract cancers tested; 0.11 % in 833 ovary cancers tested; 0.09 % in 710 oesophagus cancers tested; 0.07 % in 238 bone cancers tested; 0.06 % in 1634 lung cancers tested; 0.06 % in 127 biliary tract cancers tested; 0.05 % in 1512 liver cancers tested; 0.04 % in 382 soft tissue cancers tested; 0.04 % in 1316 breast cancers tested.
Frequency of Mutated Sites:
Most frequent mutations with the number of reports indicated in brackets: S536R (4); Q239* (3).
Comments:
Only 8 deletions, 1 insertion, and no complex mutations are noted on the COSMIC website.