
Nomenclature
Short Name:
QSK
Full Name:
Salt-inducible kinase 3
Alias:
- EC 2.7.11.1
- Serine/threonine-protein kinase QSK
- SIK family kinase 3
- SIK3
- SIK-3
- FLJ12240
- KIAA0999
- L19
- Salt-inducible kinase 3
Classification
Type:
Protein-serine/threonine kinase
Group:
CAMK
Family:
CAMKL
SubFamily:
QIK

Structure
Mol. Mass (Da):
139,980
# Amino Acids:
1263
# mRNA Isoforms:
4
mRNA Isoforms:
139,980 Da (1263 AA; Q9Y2K2); 133,715 Da (1203 AA; Q9Y2K2-4); 125,475 Da (1129 AA; Q9Y2K2-3); 65,097 Da (598 AA; Q9Y2K2-2)
4D Structure:
Binds to and is activated by YWHAZ when phosphorylated on Thr-163.
1D Structure:
Subfamily Alignment
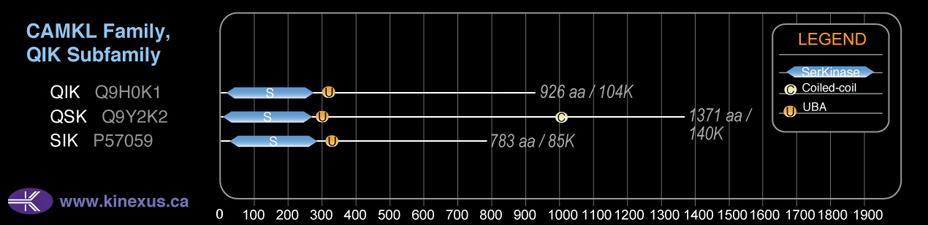
Domain Distribution:
| Start | End | Domain |
|---|---|---|
| 8 | 259 | Pkinase |
| 286 | 326 | UBA |
| 1045 | 1072 | Coiled-coil |
Kinexus Products
Click on entries below for direct links to relevant products from Kinexus for this protein kinase.
hiddentext
Post-translation Modifications
For detailed information on phosphorylation of this kinase go to PhosphoNET
Acetylated:
M1, K23.
Serine phosphorylated:
S84, S390, S493, S533, S534, S562, S568, S601, S641, S642, S672, S673, S676, S697, S797, S808, S811, S916, S920, S1024, S1028, S1108.
Threonine phosphorylated:
T13, T121, T163+, T224, T271, T411, T519, T635, T1159.
Tyrosine phosphorylated:
Y404, Y512, Y604, Y957, Y1167, Y1249.
Ubiquitinated:
K41, K50, K132, K260.
Distribution
Based on gene microarray analysis from the NCBI
Human Tissue Distribution
% Max Expression:
Mean Expression:
Number of Samples:
Standard Deviation:
% Max Expression:
Mean Expression:
Number of Samples:
Standard Deviation:
 100
100
998
64
953
 9
9
91
29
68
 13
13
127
9
55
 56
56
555
212
571
 81
81
806
61
568
 5
5
52
174
58
 18
18
178
79
384
 72
72
722
64
1020
 44
44
444
31
297
 11
11
112
150
77
 11
11
112
46
77
 77
77
766
300
644
 8
8
76
53
41
 8
8
84
21
67
 23
23
234
34
931
 8
8
81
40
74
 9
9
88
233
71
 9
9
92
24
59
 12
12
120
163
75
 66
66
655
261
613
 21
21
205
30
190
 10
10
104
38
106
 12
12
117
13
99
 29
29
288
24
223
 13
13
125
30
137
 81
81
806
126
1142
 7
7
69
56
41
 10
10
95
24
61
 11
11
105
24
65
 12
12
122
56
83
 71
71
711
36
840
 77
77
770
76
998
 8
8
79
92
57
 80
80
797
156
637
 97
97
964
87
1879
Evolution
Species Conservation
PhosphoNET % Identity:
PhosphoNET % Similarity:
Homologene %
Identity:
PhosphoNET % Identity:
PhosphoNET % Similarity:
Homologene %
Identity:
 100
100
100
100 99.6
99.6
99.8
100 -
-
-
98 -
-
-
94 -
-
-
87 89
89
92.1
93 -
-
-
- 88.4
88.4
91.7
91.5 28.5
28.5
40.6
91 -
-
-
- 70.9
70.9
76.8
- 29.5
29.5
43.5
85 -
-
-
76 58.4
58.4
69.6
68 -
-
-
- 26.9
26.9
38.6
45 32.2
32.2
44.9
- -
-
-
- 30.7
30.7
46
- -
-
-
- -
-
-
- -
-
-
- -
-
-
- -
-
-
- -
-
-
-
For a wider analysis go to PhosphoNET Evolution in PhosphoNET
Binding Proteins
Examples of known interacting proteins
hiddentext
| No. | Name – UniProt ID |
|---|---|
| 1 | NUAK1 - O60285 |
| 2 | CRTC2 - Q53ET0 |
| 3 | YWHAZ - P63104 |
| 4 | YWHAE - P62258 |
Regulation
Activation:
Activated by phosphorylation on Thr-163 by STK11 in complex with STE20-related adapter-alpha (STRAD alpha) pseudo kinase and CAB39.
Inhibition:
NA
Synthesis:
NA
Degradation:
NA
Known Upstream Kinases
For further details on these substrates click on the Substrate Short Name or UniProt ID. Phosphosite Location is hyperlinked to PhosphoNET
predictions.
Based on in vitro and/or in vivo phosphorylation data
| Kinase Short Name | UniProt ID (Human) | Phosphosite Location | Phosphosite Sequence | Effect of Phosphorylation |
|---|
Protein Kinase Specificity
Matrix of observed frequency (%) of amino acids in aligned protein substrate phosphosites
Matrix Type:
Predicted from the application of the Kinexus Kinase Substrate Predictor Version 2.0 algorithm, which was trained with over 10,000 kinase-protein substrate pairs and 8,000 kinase-peptide substrate pairs.
Domain #:
1
Inhibitors
For further details on these inhibitors click on the Compound Name and enter it into DrugKiNET or click on the ID's
Based on in vitro and/or in vivo phosphorylation data
| Compound Name | KD, Ki or IC50 (nM) | PubChem ID | ChEMBL ID | PubMed ID |
|---|
Disease Linkage
General Disease Association:
Cardiovascular disorders
Specific Diseases (Non-cancerous):
Cardiac hypertrophy
Comments:
Cardiac hypertrophy is a cardiovascular condition characterized by the thickening of the heart muscle. Pathological cardiac hypertrophy can be the result of hypertension, myocardial damage, heart failure, valvular heart disease, or an endocrine imbalance. In animal studies, reduced expression levels of SIK3 were observed in the cardiac muscle of spontaneously hypertensive rats (SHR), correlated with the overexpression of cardiac hypertrophy marker genes, such as skeletal muscle actin (SkA), Beta-myosin heavy chain (Beta-MC), and matrix metalloproteinase-9 (MMP-9). Therefore, SIK3 is suggested as an upstream regulatory factor of the expression of several cardiac hypertrophic growth genes, thus dysfunction in SIK3 protein could contribute to the pathogenesis of cardiac hypertrophy.
Gene Expression in Cancers:
TranscriptoNET (www.transcriptonet.ca) analysis with mRNA expression data retrieved from the National Center for Biotechnology Information's Gene Expression Omnibus (GEO) database, which was normalized against 60 abundantly and commonly found proteins, indicated altered expression for this protein kinase as shown here as the percent change from normal tissue controls (%CFC) as supported with the Student T-test in human Breast epithelial carcinomas (%CFC= -55, p<0.0009). The COSMIC website notes an up-regulated expression score for QSK in diverse human cancers of 288, which is 0.6-fold of the average score of 462 for the human protein kinases. The down-regulated expression score of 190 for this protein kinase in human cancers was 3.2-fold of the average score of 60 for the human protein kinases.
Mutagenesis Experiments:
Insertional mutagenesis studies in mice support a role for this protein kinase in mouse cancer oncogenesis.
Mutation Rate in All Cancers:
Percent mutation rates per 100 amino acids length in human cancers: 0.07 % in 25392 diverse cancer specimens. This rate is only -11 % lower than the average rate of 0.075 % calculated for human protein kinases in general.
Mutation Rate in Specific Cancers:
Highest percent mutation rates per 100 amino acids length in human cancers: 0.3 % in 805 skin cancers tested; 0.3 % in 1119 large intestine cancers tested; 0.27 % in 589 stomach cancers tested; 0.22 % in 602 endometrium cancers tested; 0.09 % in 1753 lung cancers tested; 0.07 % in 1504 breast cancers tested.
Frequency of Mutated Sites:
None > 8 in 20,675 cancer specimens
Comments:
Only 2 deletions, and no insertions or complex mutations are noted on the COSMIC website.