
Nomenclature
Short Name:
RIOK2
Full Name:
Serine-threonine-protein kinase RIO2
Alias:
- EC 2.7.11.1
- FLJ11159
- Kinase RIOK2
- RIO kinase 2
Classification
Type:
Protein-serine/threonine kinase
Group:
Atypical
Family:
RIO
SubFamily:
RIO2

Structure
Mol. Mass (Da):
63283
# Amino Acids:
552
# mRNA Isoforms:
2
mRNA Isoforms:
63,283 Da (552 AA; Q9BVS4); 54,508 Da (474 AA; Q9BVS4-2)
4D Structure:
NA
1D Structure:
Subfamily Alignment
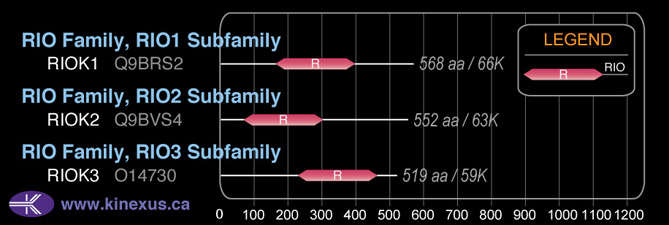
Domain Distribution:
Kinexus Products
Click on entries below for direct links to relevant products from Kinexus for this protein kinase.
hiddentext
Post-translation Modifications
For detailed information on phosphorylation of this kinase go to PhosphoNET
Serine phosphorylated:
S131, S332, S335, S337, S350, S354, S362, S380, S382, S385, S390, S412, S417, S442, S457, S483, S486, S487, S489, S492, S494, S548.
Threonine phosphorylated:
T21, T130, T414, T481, T485, T495.
Tyrosine phosphorylated:
Y181, Y348, Y366, Y426, Y445.
Ubiquitinated:
K86, K288, K377.
Distribution
Based on gene microarray analysis from the NCBI
Human Tissue Distribution
% Max Expression:
Mean Expression:
Number of Samples:
Standard Deviation:
% Max Expression:
Mean Expression:
Number of Samples:
Standard Deviation:
 100
100
1089
22
943
 2
2
23
9
22
 9
9
94
10
82
 19
19
209
82
375
 67
67
731
24
632
 6
6
62
46
32
 4
4
46
25
29
 76
76
826
32
1719
 46
46
502
10
507
 5
5
56
59
29
 7
7
80
23
116
 71
71
777
80
645
 12
12
128
21
183
 3
3
31
6
32
 10
10
107
20
137
 5
5
52
12
41
 5
5
54
167
93
 7
7
76
15
88
 10
10
111
64
102
 65
65
707
84
626
 9
9
96
19
135
 10
10
106
21
170
 14
14
157
11
166
 8
8
86
15
88
 6
6
68
19
85
 54
54
588
54
638
 9
9
95
24
98
 8
8
89
15
100
 10
10
105
15
128
 3
3
31
28
26
 97
97
1060
18
693
 15
15
167
80
397
 54
54
593
63
921
 83
83
907
52
714
 7
7
76
35
71
Evolution
Species Conservation
PhosphoNET % Identity:
PhosphoNET % Similarity:
Homologene %
Identity:
PhosphoNET % Identity:
PhosphoNET % Similarity:
Homologene %
Identity:
 100
100
100
100 99.1
99.1
99.6
99 96.6
96.6
98.7
97 -
-
-
87 -
-
-
98 81.7
81.7
88.6
85 -
-
-
- 83
83
91.3
84 81.7
81.7
90
82 -
-
-
- 62.5
62.5
72.1
- 65.6
65.6
79.2
70 67.2
67.2
80.1
69 67.4
67.4
77.9
74 -
-
-
- 44.4
44.4
62.7
49.5 47.6
47.6
62.9
- 41.9
41.9
60.1
60 49.5
49.5
65
- -
-
-
- -
-
-
- -
-
-
59 -
-
-
59 31.5
31.5
48.2
46 -
-
-
57
For a wider analysis go to PhosphoNET Evolution in PhosphoNET
Binding Proteins
Examples of known interacting proteins
hiddentext
| No. | Name – UniProt ID |
|---|---|
| 1 | RPS13 - P62277 |
| 2 | DIMT1L - Q9UNQ2 |
| 3 | PNO1 - Q9NRX1 |
| 4 | BYSL - Q13895 |
| 5 | RPS3 - P23396 |
| 6 | TSR1 - Q2NL82 |
| 7 | RPS9 - P46781 |
| 8 | EIF2A - Q9BY44 |
| 9 | OLA1 - Q9NTK5 |
| 10 | RPS15A - P62244 |
Regulation
Activation:
NA
Inhibition:
NA
Synthesis:
NA
Degradation:
NA
Protein Kinase Specificity
Matrix of observed frequency (%) of amino acids in aligned protein substrate phosphosites
Matrix Type:
Predicted from the application of the Kinexus Kinase Substrate Predictor Version 2.0 algorithm, which was trained with over 10,000 kinase-protein substrate pairs and 8,000 kinase-peptide substrate pairs.
Domain #:
1
Inhibitors
For further details on these inhibitors click on the Compound Name and enter it into DrugKiNET or click on the ID's
Based on in vitro and/or in vivo phosphorylation data
| Compound Name | KD, Ki or IC50 (nM) | PubChem ID | ChEMBL ID | PubMed ID |
|---|
| Sunitinib | Kd = 49 nM | 5329102 | 535 | 22037378 |
| N-Benzoylstaurosporine | Kd = 97 nM | 56603681 | 608533 | 22037378 |
| SU14813 | Kd = 140 nM | 10138259 | 1721885 | 22037378 |
| Tozasertib | Kd = 250 nM | 5494449 | 572878 | 22037378 |
| Dovitinib | Kd = 260 nM | 57336746 | 22037378 | |
| Staurosporine | Kd = 390 nM | 5279 | 22037378 | |
| AST-487 | Kd = 550 nM | 11409972 | 574738 | 22037378 |
| Pazopanib | Kd = 610 nM | 10113978 | 477772 | 22037378 |
| PI-103 | Kd = 770 nM | 16739368 | 538346 | 22037378 |
| PLX4720 | Kd = 770 nM | 24180719 | 1230020 | 22037378 |
| WZ3146 | Kd > 1 µM | 44607360 | 20033049 | |
| WZ4002 | Kd > 1 µM | 44607530 | 20033049 | |
| GDC0879 | Kd = 1.2 µM | 11717001 | 525191 | 22037378 |
| Ruxolitinib | Kd = 1.2 µM | 25126798 | 1789941 | 22037378 |
| AC1NS7CD | Kd = 1.5 µM | 5329665 | 295136 | 22037378 |
| SNS032 | Kd = 1.5 µM | 3025986 | 296468 | 22037378 |
| TG100115 | Kd = 1.5 µM | 10427712 | 230011 | 22037378 |
| Masitinib | Kd = 1.7 µM | 10074640 | 22037378 | |
| GSK1838705A | Kd = 2 µM | 25182616 | 464552 | 22037378 |
| TG101348 | Kd = 2.6 µM | 16722836 | 1287853 | 22037378 |
| R406 | Kd = 3.4 µM | 11984591 | 22037378 | |
| BMS-690514 | Kd < 4.5 µM | 11349170 | 21531814 |
Disease Linkage
General Disease Association:
Cancer
Specific Cancer Types:
Glioblastomas
Comments:
Drosophila studies showed that RIOK2 mediated cell proliferation and survival in glioblastoma.
Gene Expression in Cancers:
TranscriptoNET (www.transcriptonet.ca) analysis with mRNA expression data retrieved from the National Center for Biotechnology Information's Gene Expression Omnibus (GEO) database, which was normalized against 60 abundantly and commonly found proteins, indicated altered expression for this protein kinase as shown here as the percent change from normal tissue controls (%CFC) as supported with the Student T-test in the following types of human cancers: Clear cell renal cell carcinomas (cRCC) (%CFC= +87, p<0.059); Large B-cell lymphomas (%CFC= +58, p<0.005); Ovary adenocarcinomas (%CFC= -50, p<0.0001); Pituitary adenomas (ACTH-secreting) (%CFC= +56); and Prostate cancer - metastatic (%CFC= -45, p<0.0002). The COSMIC website notes an up-regulated expression score for RIOK2 in diverse human cancers of 459, which is close to the average score of 462 for the human protein kinases. The down-regulated expression score of 402 for this protein kinase in human cancers was 6.7-fold of the average score of 60 for the human protein kinases.
Mutagenesis Experiments:
Insertional mutagenesis studies in mice have not yet revealed a role for this protein kinase in mouse cancer oncogenesis.
Mutation Rate in All Cancers:
Percent mutation rates per 100 amino acids length in human cancers: 0.07 % in 24896 diverse cancer specimens. This rate is only -4 % lower and is very similar to the average rate of 0.075 % calculated for human protein kinases in general.
Mutation Rate in Specific Cancers:
Highest percent mutation rates per 100 amino acids length in human cancers: 0.3 % in 603 endometrium cancers tested; 0.3 % in 1270 large intestine cancers tested; 0.23 % in 864 skin cancers tested; 0.23 % in 548 urinary tract cancers tested; 0.18 % in 589 stomach cancers tested; 0.16 % in 1512 liver cancers tested; 0.09 % in 1634 lung cancers tested; 0.08 % in 441 autonomic ganglia cancers tested; 0.08 % in 238 bone cancers tested; 0.07 % in 273 cervix cancers tested; 0.06 % in 558 thyroid cancers tested; 0.06 % in 1316 breast cancers tested; 0.05 % in 710 oesophagus cancers tested; 0.05 % in 1459 pancreas cancers tested; 0.04 % in 833 ovary cancers tested; 0.03 % in 1276 kidney cancers tested; 0.02 % in 942 upper aerodigestive tract cancers tested; 0.02 % in 881 prostate cancers tested; 0.01 % in 2103 central nervous system cancers tested.
Frequency of Mutated Sites:
Most frequent mutations with the number of reports indicated in brackets: I484V (5).
Comments:
Only 3 deletions, and no insertions or complex mutations are noted on the COSMIC website.