
Nomenclature
Short Name:
RIOK3
Full Name:
Serine-threonine-protein kinase RIO3
Alias:
- EC 2.7.11.1
- RIO kinase 3
- SudD
Classification
Type:
Protein-serine/threonine kinase
Group:
Atypical
Family:
RIO
SubFamily:
RIO3

Structure
Mol. Mass (Da):
59,093
# Amino Acids:
519
# mRNA Isoforms:
2
mRNA Isoforms:
59,093 Da (519 AA; O14730); 58,671 Da (516 AA; O14730-2)
4D Structure:
NA
1D Structure:
Subfamily Alignment
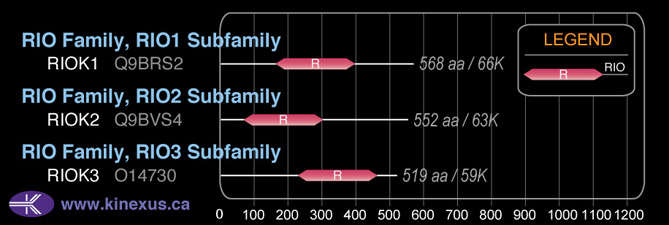
Domain Distribution:
Post-translation Modifications
For detailed information on phosphorylation of this kinase go to PhosphoNET
Serine phosphorylated:
S8, S107, S110, S112, S125, S127, S128, S505.
Threonine phosphorylated:
T150.
Tyrosine phosphorylated:
Y116, Y122, Y142, Y517.
Ubiquitinated:
K108, K146, K197, K207, K290, K300, K318, K452, K456, K508.
Distribution
Based on gene microarray analysis from the NCBI
Human Tissue Distribution
% Max Expression:
Mean Expression:
Number of Samples:
Standard Deviation:
% Max Expression:
Mean Expression:
Number of Samples:
Standard Deviation:
 57
57
1098
61
1041
 6
6
110
28
122
 53
53
1018
16
693
 29
29
548
196
648
 48
48
929
57
703
 13
13
240
170
227
 29
29
555
69
625
 62
62
1194
72
2149
 63
63
1210
31
764
 13
13
243
181
413
 28
28
529
53
811
 47
47
902
312
1024
 19
19
361
60
552
 6
6
111
21
129
 32
32
622
41
888
 7
7
141
35
124
 8
8
148
314
743
 33
33
641
31
838
 25
25
482
181
809
 45
45
871
243
778
 28
28
540
37
694
 24
24
461
45
613
 50
50
963
19
917
 51
51
977
31
1302
 24
24
466
37
570
 50
50
951
119
780
 30
30
572
63
944
 43
43
822
30
1543
 33
33
627
31
714
 100
100
1918
70
2022
 41
41
786
36
797
 54
54
1029
65
1068
 11
11
216
148
454
 55
55
1046
130
734
 84
84
1619
74
2381
Evolution
Species Conservation
PhosphoNET % Identity:
PhosphoNET % Similarity:
Homologene %
Identity:
PhosphoNET % Identity:
PhosphoNET % Similarity:
Homologene %
Identity:
 100
100
100
100 99.8
99.8
100
100 52
52
52.2
- -
-
-
96 -
-
-
- 96.3
96.3
97.9
96 -
-
-
- 93.8
93.8
97.5
93 94
94
97.7
94 -
-
-
- 85.2
85.2
90
- 86.9
86.9
91.5
87.5 76.1
76.1
85.5
77.5 71.3
71.3
81.3
76 -
-
-
- 37.5
37.5
53.4
49 -
-
-
- 33
33
53.6
39 39.5
39.5
49.1
- -
-
-
- -
-
-
- -
-
-
- -
-
-
- -
-
-
- -
-
-
-
For a wider analysis go to PhosphoNET Evolution in PhosphoNET
Binding Proteins
Examples of known interacting proteins
hiddentext
| No. | Name – UniProt ID |
|---|---|
| 1 | ARL1 - P40616 |
| 2 | CALM1 - P62158 |
| 3 | C2orf61 - Q8N801 |
| 4 | FBL - P22087 |
| 5 | PSMB1 - P20618 |
| 6 | GAR1 - Q9NY12 |
| 7 | CALM1 - P62158 |
Regulation
Activation:
NA
Inhibition:
NA
Synthesis:
NA
Degradation:
NA
Protein Kinase Specificity
Matrix of observed frequency (%) of amino acids in aligned protein substrate phosphosites
Matrix Type:
Predicted from the application of the Kinexus Kinase Substrate Predictor Version 2.0 algorithm, which was trained with over 10,000 kinase-protein substrate pairs and 8,000 kinase-peptide substrate pairs.
Domain #:
1
Inhibitors
For further details on these inhibitors click on the Compound Name and enter it into DrugKiNET or click on the ID's
Based on in vitro and/or in vivo phosphorylation data
| Compound Name | KD, Ki or IC50 (nM) | PubChem ID | ChEMBL ID | PubMed ID |
|---|
Disease Linkage
Gene Expression in Cancers:
TranscriptoNET (www.transcriptonet.ca) analysis with mRNA expression data retrieved from the National Center for Biotechnology Information's Gene Expression Omnibus (GEO) database, which was normalized against 60 abundantly and commonly found proteins, indicated altered expression for this protein kinase as shown here as the percent change from normal tissue controls (%CFC) as supported with the Student T-test in the following types of human cancers: Bladder carcinomas (%CFC= +57, p<0.006); Brain glioblastomas (%CFC= -67, p<0.012); Brain oligodendrogliomas (%CFC= -70, p<0.011); Cervical cancer (%CFC= +59, p<0.003); Clear cell renal cell carcinomas (cRCC) stage I (%CFC= -85, p<0.0001); Prostate cancer - primary (%CFC= -87, p<0.0001); Skin melanomas - malignant (%CFC= -52, p<0.01); and Vulvar intraepithelial neoplasia (%CFC= +54, p<0.052). The COSMIC website notes an up-regulated expression score for RIOK3 in diverse human cancers of 492, which is close to the average score of 462 for the human protein kinases. The down-regulated expression score of 126 for this protein kinase in human cancers was 2.1-fold of the average score of 60 for the human protein kinases.
Mutagenesis Experiments:
Insertional mutagenesis studies in mice support a role for this protein kinase in mouse cancer oncogenesis.
Mutation Rate in All Cancers:
Percent mutation rates per 100 amino acids length in human cancers: 0.06 % in 24726 diverse cancer specimens. This rate is only -15 % lower than the average rate of 0.075 % calculated for human protein kinases in general.
Mutation Rate in Specific Cancers:
Highest percent mutation rates per 100 amino acids length in human cancers: 0.29 % in 603 endometrium cancers tested; 0.27 % in 1270 large intestine cancers tested; 0.23 % in 589 stomach cancers tested; 0.21 % in 548 urinary tract cancers tested; 0.18 % in 864 skin cancers tested; 0.15 % in 127 biliary tract cancers tested; 0.14 % in 273 cervix cancers tested; 0.12 % in 1634 lung cancers tested; 0.08 % in 1276 kidney cancers tested; 0.07 % in 833 ovary cancers tested; 0.04 % in 2082 central nervous system cancers tested; 0.03 % in 710 oesophagus cancers tested; 0.03 % in 1512 liver cancers tested; 0.02 % in 942 upper aerodigestive tract cancers tested; 0.02 % in 2009 haematopoietic and lymphoid cancers tested; 0.01 % in 1459 pancreas cancers tested; 0.01 % in 1316 breast cancers tested.
Frequency of Mutated Sites:
None > 5 in 20,009 cancer specimens
Comments:
Only 2 deletions, and no insertions or complex mutations are noted on the COSMIC website.