• KinATLAS
  • TranscriptoNET
  • PhosphoNET
  • OncoNET
  • KinaseNET
  • DrugKiNET
  • DrugProNET
  • KiNET-AM
  • Kinetica Online

Updated November 2019

Home | Kinexus | Contact | Credits

Nomenclature

Short Name:
RIPK2
Full Name:
Receptor-interacting serine-threonine-protein kinase 2
Alias:
  • CARD3
  • EC 2.7.11.1
  • GIG30
  • RICK
  • RIP2
  • Kinase RIPK2; Receptor-interacting protein 2; Receptor-interacting serine/threonine protein kinase 2; RIP-like-interacting CLARP kinase
  • CARD-containing IL-1 beta ICE-kinase
  • CARD-containing interleukin-1 beta converting enzyme associated kinase
  • CARD-containing interleukin-1 beta-converting enzyme-associated kinase
  • CARDIAK

Classification

Type:
Protein-serine/threonine kinase
Group:
TKL
Family:
RIPK
SubFamily:
NA


Specific Links

BioCarta Entry: fas pathway
Entrez-Gene Entry: 8767
Entrez-Protein Entry: NP_003812
GeneCards Entry: RIP2
KinBASE Entry: RIPK2
OMIM Entry: 603455
Pfam Entry: O43353
PhosphoNET Entry: O43353
Phosphosite Plus Entry: 751
ScanSite Entry: O43353
Source Entry: RIPK2
UCSD-Nature Entry: A002083
UniProt Entry: O43353
Kinexus Products: RIPK2
Receptor-interacting serine/threonine-protein kinase 2 (RIPK2) S176 phosphosite-specific antibody AB-PK796
Receptor-interacting serine/threonine-protein kinase 2 (RIPK2) Y381 phosphosite-specific antibody AB-PK797
Receptor-interacting serine/threonine-protein kinase 2 (RIPK2) (M173-R179, human) pS176 phosphopeptide - Powder PE-04API75
Receptor-interacting serine/threonine-protein kinase 2 (RIPK2) (Q378-K384, human) pY381 phosphopeptide - Powder PE-04APJ90

General Links

ClustalW2
GPS-Cuckoo
Human Protein Atlas
Kinase.com
Kinase Research
Kinasource
Kinomer
Netphorest
NetworKIN
Phosida
PhosphoElm
Protein Blast
ScanSite
String

Structure

Mol. Mass (Da):
61,195
# Amino Acids:
540
# mRNA Isoforms:
2
mRNA Isoforms:
61,195 Da (540 AA; O43353); 45,582 Da (403 AA; O43353-2)
4D Structure:
Binds to CFLAR/CLARP and CASP1 via their CARD domains. Binds to BIRC3/c-IAP1 and BIRC2/c-IAP2, TRAF1, TRAF2, TRAF5 and TRAF6. May be a component of both the TNFRSF1A and TNRFSF5/CD40 receptor complex. Interacts with NOD2.
1D Structure:
Retrieve Gene Sequence
Retrieve Full Protein Sequence
Retrieve Catalytic Domain Sequence
 
3D Image (rendered using PV Viewer):

PDB ID
5AR2

Subfamily Alignment
subfamily domain
 
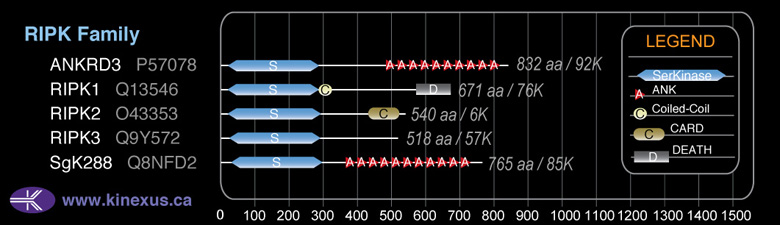
Domain Distribution:
Start End Domain
18 294 Pkinase
432 524 CARD
 

Kinexus Products

Click on entries below for direct links to relevant products from Kinexus for this protein kinase.
hiddentext
○ Receptor-interacting serine/threonine-protein kinase 2 (RIPK2) S176 phosphosite-specific antibody AB-PK796
○ Receptor-interacting serine/threonine-protein kinase 2 (RIPK2) Y381 phosphosite-specific antibody AB-PK797
○ Receptor-interacting serine/threonine-protein kinase 2 (RIPK2) (M173-R179, human) pS176 phosphopeptide - Powder PE-04API75
○ Receptor-interacting serine/threonine-protein kinase 2 (RIPK2) (Q378-K384, human) pY381 phosphopeptide - Powder PE-04APJ90
 

Post-translation Modifications

For detailed information on phosphorylation of this kinase go to PhosphoNET
Serine phosphorylated:

S168, S174, S176+, S178+, S181+, S345, S357, S363, S393, S527, S529, S531, S539.
Threonine phosphorylated:

T411.
Tyrosine phosphorylated:

Y23, Y381, Y474+.
Ubiquitinated:
K17, K182, K203, K209.
 

Distribution

Based on gene microarray analysis from the NCBI
Human Tissue Distribution
% Max Expression:

Mean Expression:

Number of Samples:

Standard Deviation:
% Max Expression:

Mean Expression:

Number of Samples:

Standard Deviation:
  • adipose
    50

    925

    29

    1064

  • adrenal
    3

    50

    15

    81

  • bladder
    3

    52

    12

    32

  • brain
    21

    395

    89

    793

  • breast
    38

    708

    24

    563

  • cervix
    4

    65

    74

    61

  • colon
    8

    145

    31

    285

  • heart
    71

    1312

    39

    3064

  • intestine
    18

    328

    17

    264

  • kidney
    3

    58

    83

    60

  • liver
    3

    55

    31

    84

  • lung
    36

    658

    163

    620

  • lymphnode
    4

    67

    34

    50

  • ovary
    2

    43

    10

    60

  • pancreas
    3

    60

    14

    94

  • pituitary
    2

    42

    15

    37

  • prostate
    1.4

    26

    119

    42

  • salivarygland
    4

    76

    21

    72

  • skeletalmuscle"
    2

    34

    87

    39

  • skin
    31

    564

    109

    575

  • spinalcord
    6

    111

    23

    87

  • spleen
    3

    64

    26

    61

  • stomach
    3

    54

    14

    47

  • testis
    2

    44

    20

    60

  • thymus
    2

    35

    23

    47

  • thyroid
    46

    842

    57

    1580

  • tonsil
    3

    59

    37

    64

  • trachea
    4

    68

    20

    65

  • uterus
    4

    71

    20

    65

  • reticulocytes"
    6

    103

    28

    84

  • t-lymphocytes
    43

    798

    24

    762

  • b-lymphocytes
    100

    1849

    36

    3323

  • neutrophils
    8

    142

    71

    258

  • macrophages
    59

    1082

    52

    741

  • sperm
    3

    54

    35

    62


Evolution

Species Conservation
PhosphoNET % Identity:
PhosphoNET % Similarity:
Homologene %
Identity:
PhosphoNET % Identity:
PhosphoNET % Similarity:
Homologene %
Identity:
  • tableheader
    100

    100

    100
  • tableheader
    99.3

    99.4

    99
  • tableheader
    97.4

    97.8

    97
  • tableheader
    -

    -

    87.5
  • tableheader
    -

    -

    -
  • tableheader
    86.7

    90.7

    87
  • tableheader
    -

    -

    -
  • tableheader
    84.3

    89.8

    84
  • tableheader
    24.8

    40.9

    85
  • tableheader
    -

    -

    -
  • tableheader
    25.7

    39.7

    -
  • tableheader
    63.4

    74.2

    69
  • tableheader
    26

    44.3

    59
  • tableheader
    49.3

    64.7

    54
  • tableheader
    -

    -

    -
  • tableheader
    -

    -

    -
  • tableheader
    -

    -

    -
  • tableheader
    -

    -

    -
  • tableheader
    -

    -

    -
  • tableheader
    -

    -

    -
  • tableheader
    -

    -

    -
  • tableheader
    -

    -

    -
  • tableheader
    -

    -

    -
  • tableheader
    -

    -

    -
  • tableheader
    -

    -

    -
For a wider analysis go to PhosphoNET Evolution in PhosphoNET
 

Binding Proteins

Examples of known interacting proteins
hiddentext
No. Name – UniProt ID
1 NOD1 - Q9Y239
2 CARD16 - Q5EG05
3 BIRC2 - Q13490
4 NOD2 - Q9HC29
5 TLR4 - O00206
6 TLR2 - O60603
7 NGFR - P08138
8 CFLAR - O15519
9 BCL10 - O95999
10 IKBKG - Q9Y6K9
11 CASP8 - Q14790
12 IRAK1 - P51617
13 TNFRSF1A - P19438
14 TRAF1 - Q13077
15 TRAF6 - Q9Y4K3
 

Regulation

Activation:
Activated by phosphorylation at Ser-176.
Inhibition:
NA
Synthesis:
NA
Degradation:
NA
 

Known Upstream Kinases

For further details on these substrates click on the Substrate Short Name or UniProt ID. Phosphosite Location is hyperlinked to PhosphoNET predictions.
Based on in vitro and/or in vivo phosphorylation data

Kinase Short Name UniProt ID (Human) Phosphosite Location Phosphosite Sequence Effect of Phosphorylation
RIPK2 O43353 S176 KWRMMSLSQSRSSKS +
RIPK2 O43353 Y474 DLIMKEDYELVSTKP +
 

Known Downstream Substrates

For further details on these substrates click on the Substrate Short Name or UniProt ID. Phosphosite Location is hyperlinked to PhosphoNET predictions.
Based on in vitro and/or in vivo phosphorylation data

Substrate Short Name UniProt ID (Human) Phosphosite Location Phosphosite Sequence Effect of Phosphorylation
RIPK2 O43353 S176 KWRMMSLSQSRSSKS +
RIPK2 O43353 Y474 DLIMKEDYELVSTKP +
 

Protein Kinase Specificity

Matrix of observed frequency (%) of amino acids in aligned protein substrate phosphosites

Kinections GIF
Matrix Type:
Predicted from the application of the Kinexus Kinase Substrate Predictor Version 2.0 algorithm, which was trained with over 10,000 kinase-protein substrate pairs and 8,000 kinase-peptide substrate pairs.
Domain #:
1
 

Inhibitors

For further details on these inhibitors click on the Compound Name and enter it into DrugKiNET or click on the ID's
Based on in vitro and/or in vivo phosphorylation data
Compound Name KD, Ki or IC50 (nM) PubChem ID ChEMBL ID PubMed ID
Vandetanib Kd = 4.6 nM 3081361 24828 18183025
CHEMBL249097 Kd < 10 nM 25138012 249097 19035792
SureCN7018367 Kd < 10 nM 18792927 450519 19035792
PD173955 Kd = 16 nM 447077 386051 22037378
SB203580 IC50 = 16 nM 176155 10 15943486
PP2 IC50 = 19 nM 4878 406845 17850214
Foretinib Kd = 21 nM 42642645 1230609 22037378
Src Kinase Inhibitor I IC50 = 26 nM 1474853 97771 17850214
Dasatinib Kd = 31 nM 11153014 1421 18183025
Princeton's TrkA inhibitor compound 20h IC50 < 40 nM
K-252a; Nocardiopsis sp. IC50 > 50 nM 3813 281948 22037377
A-83-01 IC50 < 60 nM 16218924 1170377
Amgen TBK 1 inhibitor (Compound II) IC50 < 60 nM
BML-275 IC50 < 60 nM 11524144 478629
Ibrutinib IC50 < 60 nM 24821094 1873475
KIN 112 IC50 < 60 nM
SB590885 IC50 < 60 nM 11465183 477989
STO609 IC50 < 60 nM 51371511
TTT-3002 IC50 < 60 nM
HG-9-91-01 IC50 < 80 nM
Cediranib Kd = 98 nM 9933475 491473 22037378
AG1478 IC50 < 100 nM 2051 7917
AT9283 IC50 > 100 nM 24905142 19143567
GSK650394A IC50 = 100 nM 25022668 558642
LDN193189 IC50 = 100 nM 25195294 513147
PP242 IC50 = 100 nM 25243800
Staurosporine aglycone IC50 < 100 nM 3035817 281948
PP1 Analog II; 1NM-PP1 IC50 = 130 nM 5154691 573578 17850214
Alsterpaullone; 2-Cyanoethyl IC50 > 150 nM 16760286 260138 22037377
Cdk1/2 Inhibitor III IC50 > 150 nM 5330812 261720 22037377
Lck Inhibitor IC50 > 150 nM 6603792 22037377
SB202190 Kd = 150 nM 5353940 278041 18183025
Syk Inhibitor IV IC50 = 200 nM 10200390
AG1024 IC50 > 250 nM 2044 22037377
Alsterpaullone IC50 > 250 nM 5005498 50894 22037377
BCP9000906 IC50 > 250 nM 5494425 21156 22037377
BPIQ-I IC50 > 250 nM 2427 22037377
Compound 56 IC50 > 250 nM 2857 29197 22037377
Flt-3 Inhibitor II IC50 > 250 nM 11601743 377193 22037377
HDS029 IC50 > 250 nM 11566580 203644 22037377
PD169316 IC50 > 250 nM 4712 17331 22037377
TWS119 IC50 > 250 nM 9549289 405759 22037377
WHI-P154 IC50 > 250 nM 3795 473773 22037377
Canertinib Kd = 300 nM 156414 31965 18183025
Aurora A Inhibitor 23 (DF) Kd < 400 nM 21992004
Curcumin IC50 < 400 nM 5281767 116438
IKK-3 inhibitor IX IC50 < 400 nM 11626927 373751
LY364947 IC50 < 400 nM 447966 261454
Erlotinib Kd = 410 nM 176870 553 15711537
PLX4720 Kd = 430 nM 24180719 1230020 22037378
D4476 IC50 = 500 nM 6419753 410456 22037377
Flt-3 Inhibitor III IC50 = 500 nM 11772958 22037377
Gö6976 IC50 = 500 nM 3501 302449 22037377
JAK3 Inhibitor VI IC50 = 500 nM 16760524 22037377
p38 MAP Kinase Inhibitor IC50 = 500 nM 4665 91730 22037377
PKR Inhibitor; Negative Control IC50 = 500 nM 16760619 22037377
Staurosporine IC50 = 500 nM 5279 22037377
Gefitinib Kd = 530 nM 123631 939 18183025
Pazopanib Kd = 580 nM 10113978 477772 18183025
GW 843682X IC50 < 600 nM 9826308 514499
R406 IC50 < 600 nM 11984591
SB505124 IC50 < 600 nM 16079009 1835714
Syk Inhibitor IC50 < 600 nM 6419747 104279
Lestaurtinib Kd = 640 nM 126565 22037378
K00596a IC50 < 800 nM 9549298 200027
SB431542 IC50 < 800 nM 4521392
Crizotinib Kd = 900 nM 11626560 601719 22037378
GSK-3 Inhibitor IX IC50 > 900 nM 5287844 409450
RAF265 Kd = 950 nM 11656518 558752 18183025
4557W IC50 > 1 µM 9843206 563845 22037377
AG-E-60384 IC50 > 1 µM 6419741 413188 22037377
Akt Inhibitor VIII IC50 = 1 µM 10196499 258844
Aloisine A IC50 > 1 µM 5326843 75680 22037377
AS601245 IC50 > 1 µM 11422035 191384 22037377
CHEMBL566515 Kd < 1 µM 44478401 566515 19788238
ETP 46464 IC50 = 1 µM
GSK2578215A IC50 = 1 µM
IDR E804 IC50 > 1 µM 6419764 1802727 22037377
JNKIN7 IC50 = 1 µM 57340685
JNKIN8 IC50 = 1 µM 57340686
MK5108 IC50 > 1 µM 24748204 20053775
MNK1 Inhibitor IC50 > 1 µM 11644425 1240885 22037377
PD158780 IC50 > 1 µM 4707 53753 22037377
Silmitasertib IC50 > 1 µM 24748573 21174434
SNS314 IC50 > 1 µM 16047143 514582 18678489
SU6656 IC50 = 1 µM 5353978 605003
VEGFR2 Kinase Inhibitor IV IC50 > 1 µM 5329468 92461 22037377
WZ3146 Kd > 1 µM 44607360 20033049
WZ4002 Kd > 1 µM 44607530 20033049
AST-487 Kd = 1.1 µM 11409972 574738 18183025
Sorafenib Kd = 1.3 µM 216239 1336 18183025
Barasertib Kd = 1.8 µM 16007391 215152 18183025
Quercetagetin IC50 < 2 µM 5281680 413552
GDC0879 Kd = 2.5 µM 11717001 525191 22037378
Hesperadin Kd < 2.5 µM 10142586 514409 19035792
Afatinib Kd = 2.7 µM 10184653 1173655 22037378
Quizartinib Kd = 2.7 µM 24889392 576982 22037378
Brivanib Kd = 2.9 µM 11234052 377300 22037378
GSK461364A IC50 > 3 µM 15983966 1908394
GW441756 hydrochloride IC50 > 3 µM 16219400
Syk Inhibitor II IC50 > 3 µM 16760670
Wyeth PDK1 Inhibitor Compound 1 IC50 > 3 µM
SB431542 Kd = 3.4 µM 4521392 440084 18183025
Lapatinib Kd = 3.6 µM 208908 554 18183025
Bosutinib Kd = 3.7 µM 5328940 288441 22037378
KW2449 Kd = 3.7 µM 11427553 1908397 22037378
BMS-690514 Kd < 4 µM 11349170 21531814
JNJ-28871063 IC50 > 4 µM 17747413 17975007
BX795 IC50 > 4.5 µM 10077147 577784
 

Disease Linkage

Comments:
RIPK2 variants were shown to associate with susceptibility to Mycobacterium leprae in Indian populations.
 
Gene Expression in Cancers:

TranscriptoNET (www.transcriptonet.ca) analysis with mRNA expression data retrieved from the National Center for Biotechnology Information's Gene Expression Omnibus (GEO) database, which was normalized against 60 abundantly and commonly found proteins, indicated altered expression for this protein kinase as shown here as the percent change from normal tissue controls (%CFC) as supported with the Student T-test in the following types of human cancers: Classical Hodgkin lymphomas (%CFC= +56, p<0.086); Colon mucosal cell adenomas (%CFC= +102, p<0.0001); Large B-cell lymphomas (%CFC= +78, p<0.052); Malignant pleural mesotheliomas (MPM) tumours (%CFC= +107, p<0.009). The COSMIC website notes an up-regulated expression score for RIPK2 in diverse human cancers of 830, which is 1.8-fold of the average score of 462 for the human protein kinases. The down-regulated expression score of 8 for this protein kinase in human cancers was 0.1-fold of the average score of 60 for the human protein kinases.
Mutagenesis Experiments:

Insertional mutagenesis studies in mice have not yet revealed a role for this protein kinase in mouse cancer oncogenesis.
Mutation Rate in All Cancers:

Percent mutation rates per 100 amino acids length in human cancers: 0.06 % in 24945 diverse cancer specimens. This rate is only -16 % lower than the average rate of 0.075 % calculated for human protein kinases in general.
Mutation Rate in Specific Cancers:

Highest percent mutation rates per 100 amino acids length in human cancers: 0.28 % in 1270 large intestine cancers tested; 0.26 % in 864 skin cancers tested; 0.21 % in 603 endometrium cancers tested; 0.19 % in 589 stomach cancers tested; 0.1 % in 710 oesophagus cancers tested; 0.1 % in 548 urinary tract cancers tested; 0.07 % in 833 ovary cancers tested; 0.07 % in 273 cervix cancers tested; 0.07 % in 1512 liver cancers tested; 0.07 % in 1276 kidney cancers tested; 0.06 % in 881 prostate cancers tested; 0.06 % in 1316 breast cancers tested; 0.05 % in 1634 lung cancers tested; 0.05 % in 1459 pancreas cancers tested; 0.04 % in 942 upper aerodigestive tract cancers tested; 0.01 % in 2103 central nervous system cancers tested.
Frequency of Mutated Sites:

None > 1 in 20,197 cancer specimens
Comments:
Only 1 insertion, and no deletions or complex mutations are noted in COSMIC website.
 
COSMIC Entry:
RIPK2
OMIM Entry:
603455
  • Home
  • Top of Page
Copyright 2019 Kinexus BioInformatics Corporation