
Nomenclature
Short Name:
RIPK3
Full Name:
Receptor-interacting serine-threonine-protein kinase 3
Alias:
- RIP-like protein kinase 3
- Receptor-interacting protein 3
- RIP-3
Classification
Type:
Protein-serine/threonine kinase
Group:
TKL
Family:
RIPK
SubFamily:
NA

Structure
Mol. Mass (Da):
56887
# Amino Acids:
518
# mRNA Isoforms:
3
mRNA Isoforms:
56,887 Da (518 AA; Q9Y572); 27,574 Da (252 AA; Q9Y572-2); 25,326 Da (231 AA; Q9Y572-3)
4D Structure:
Binds TRAF2 and RIPK1 and is recruited to the TNFR-1 signaling complex.
1D Structure:
Subfamily Alignment
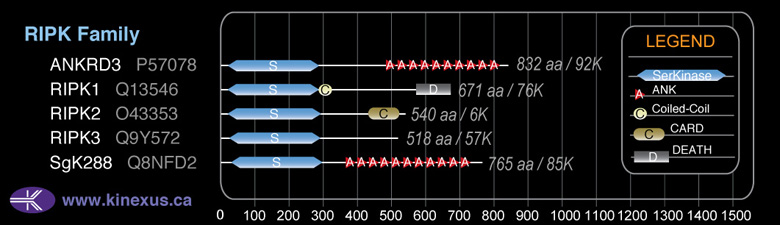
Domain Distribution:
| Start | End | Domain |
|---|---|---|
| 21 | 287 | Pkinase |
Post-translation Modifications
For detailed information on phosphorylation of this kinase go to PhosphoNET
Serine phosphorylated:
S227, S299, S316, S320, S339, S359, S372, S410.
Threonine phosphorylated:
T300, T325, T398, T412.
Distribution
Based on gene microarray analysis from the NCBI
Human Tissue Distribution
% Max Expression:
Mean Expression:
Number of Samples:
Standard Deviation:
% Max Expression:
Mean Expression:
Number of Samples:
Standard Deviation:
 98
98
1505
9
1101
 2
2
32
4
3
 4
4
56
9
52
 2
2
32
40
20
 33
33
504
13
428
 4
4
56
9
26
 7
7
109
13
53
 3
3
52
14
35
 3
3
52
3
0
 4
4
63
37
45
 3
3
42
14
40
 30
30
458
31
461
 8
8
120
9
55
 1
1
22
3
2
 5
5
73
5
75
 2
2
25
5
10
 5
5
77
77
45
 9
9
136
12
234
 9
9
140
30
114
 51
51
780
31
495
 3
3
48
14
45
 7
7
107
14
96
 6
6
89
9
56
 1
1
20
12
28
 8
8
119
14
121
 30
30
462
29
564
 3
3
47
12
48
 7
7
105
12
124
 3
3
47
12
38
 13
13
197
14
94
 100
100
1536
12
35
 4
4
62
11
72
 4
4
63
48
327
 65
65
996
26
723
 3
3
44
22
41
Evolution
Species Conservation
PhosphoNET % Identity:
PhosphoNET % Similarity:
Homologene %
Identity:
PhosphoNET % Identity:
PhosphoNET % Similarity:
Homologene %
Identity:
 100
100
100
100 98.6
98.6
99.2
99 89.5
89.5
93
90 -
-
-
74 -
-
-
74 -
-
-
63 -
-
-
- 57.7
57.7
67.3
63 56.7
56.7
66.8
61 -
-
-
- -
-
-
- -
-
-
- 25.1
25.1
39.2
41 -
-
-
43 -
-
-
- -
-
-
- -
-
-
- -
-
-
- -
-
-
- -
-
-
- -
-
-
- -
-
-
- -
-
-
- -
-
-
- -
-
-
-
For a wider analysis go to PhosphoNET Evolution in PhosphoNET
Binding Proteins
Examples of known interacting proteins
hiddentext
| No. | Name – UniProt ID |
|---|---|
| 1 | TICAM1 - Q8IUC6 |
| 2 | TRIM69 - Q86WT6 |
| 3 | TNFRSF1A - P19438 |
| 4 | RIPK1 - Q13546 |
| 5 | TRAF2 - Q12933 |
| 6 | AIFM1 - O95831 |
| 7 | RPS27A - P62988 |
Regulation
Activation:
NA
Inhibition:
NA
Synthesis:
NA
Degradation:
NA
Protein Kinase Specificity
Matrix of observed frequency (%) of amino acids in aligned protein substrate phosphosites
Matrix Type:
Predicted from the application of the Kinexus Kinase Substrate Predictor Version 2.0 algorithm, which was trained with over 10,000 kinase-protein substrate pairs and 8,000 kinase-peptide substrate pairs.
Domain #:
1
Disease Linkage
General Disease Association:
Metabolic disorders
Specific Diseases (Non-cancerous):
Gaucher's disease
Comments:
Gaucher's disease is a metabolic disease characterized by the abnormal accumulation of the glycolipid glucocerebroside in the spleen, liver, kidneys, lungs, brain, and bone marrow. The disease is the most common lysosomal storage disease and is caused by defective functioning of the enzyme glucocerebrosidase, which normally acts on glucocerebroside. Symptoms include enlarged spleen and liver, skeletal malformations and lesions, severe neurological deficits, low blood platelets, anemia, and brownish-coloured skin. In animal studies, mice models of Gaucher's disease that lacked RIPK3 expression displayed increased survival and motor coordination, as well as mitigation of cerebral and hepatic injury compared to mice with RIPK3 expression. Therefore, RIPK3 overexpression may play a role in the pathogenesis of Gaucher's disease.
Gene Expression in Cancers:
The COSMIC website notes an up-regulated expression score for RIPK3 in diverse human cancers of 270, which is 0.6-fold of the average score of 462 for the human protein kinases. The down-regulated expression score of 4 for this protein kinase in human cancers was 0.1-fold of the average score of 60 for the human protein kinases.
Mutagenesis Experiments:
Insertional mutagenesis studies in mice have not yet revealed a role for this protein kinase in mouse cancer oncogenesis.
Mutation Rate in All Cancers:
Percent mutation rates per 100 amino acids length in human cancers: 0.07 % in 24945 diverse cancer specimens. This rate is only -1 % lower and is very similar to the average rate of 0.075 % calculated for human protein kinases in general.
Mutation Rate in Specific Cancers:
Highest percent mutation rates per 100 amino acids length in human cancers: 0.54 % in 864 skin cancers tested; 0.29 % in 1270 large intestine cancers tested; 0.22 % in 603 endometrium cancers tested; 0.18 % in 548 urinary tract cancers tested; 0.16 % in 589 stomach cancers tested; 0.11 % in 710 oesophagus cancers tested; 0.1 % in 1512 liver cancers tested; 0.07 % in 273 cervix cancers tested; 0.06 % in 1316 breast cancers tested; 0.05 % in 833 ovary cancers tested; 0.05 % in 1276 kidney cancers tested; 0.04 % in 2009 haematopoietic and lymphoid cancers tested; 0.03 % in 1822 lung cancers tested; 0.02 % in 942 upper aerodigestive tract cancers tested; 0.02 % in 881 prostate cancers tested; 0.02 % in 2103 central nervous system cancers tested; 0.01 % in 1459 pancreas cancers tested.
Frequency of Mutated Sites:
Most frequent mutations with the number of reports indicated in brackets: G478S (3).
Comments:
Only 3 deletions, no insertions or complex mutations.