
Nomenclature
Short Name:
SPEG
Full Name:
Aortic preferentially expressed protein 1
Alias:
- Aortic preferentially expressed protein 1
- APEG1
- EC 2.7.11.1
- KIAA1297
Classification
Type:
Protein-serine/threonine kinase
Group:
CAMK
Family:
Trio
SubFamily:
NA

Structure
Mol. Mass (Da):
354,289
# Amino Acids:
3267
# mRNA Isoforms:
4
mRNA Isoforms:
354,289 Da (3267 AA; Q15772); 348,903 Da (3223 AA; Q15772-1); 18,673 Da (170 AA; Q15772-3); 12,692 Da (113 AA; Q15772-4)
4D Structure:
Isoform 3 is found as a monomer or homodimer
1D Structure:
Subfamily Alignment
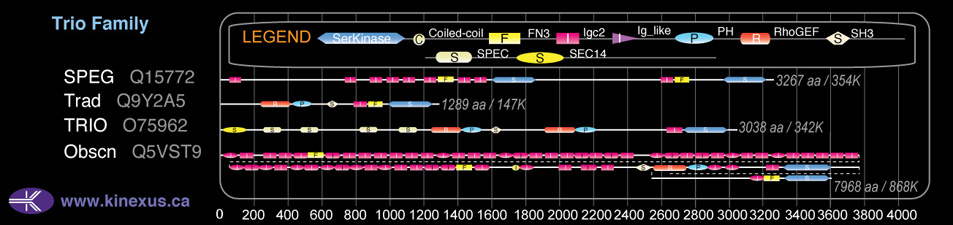
Domain Distribution:
Post-translation Modifications
For detailed information on phosphorylation of this kinase go to PhosphoNET
Acetylated:
K563, K2083.
Serine phosphorylated:
S19, S58, S258, S261, S313, S334, S371, S378, S381, S390, S435, S453, S476, S485, S488, S506, S513, S526, S537, S540, S549, S557, S560, S609, S853, S1128, S1172, S1598, S2014, S2015, S2037, S2045, S2047, S2109, S2128, S2129, S2130, S2171, S2284, S2393, S2410, S2439, S2444, S2448, S2458, S2471, S2474, S2481, S2484, S2496, S2521, S2524, S2658, S2944, S2945, S2948.
Threonine phosphorylated:
T218, T333, T375, T449, T599, T2495, T2518, T2844, T3254.
Distribution
Based on gene microarray analysis from the NCBI
Human Tissue Distribution
% Max Expression:
Mean Expression:
Number of Samples:
Standard Deviation:
% Max Expression:
Mean Expression:
Number of Samples:
Standard Deviation:
 23
23
1161
36
1479
 0.5
0.5
26
15
34
 2
2
83
5
88
 4
4
208
101
439
 13
13
641
33
562
 2
2
97
62
254
 2
2
109
42
298
 9
9
464
30
680
 4
4
189
13
226
 1
1
49
78
109
 1.3
1.3
66
23
134
 10
10
521
136
550
 0.6
0.6
30
16
16
 0.5
0.5
28
10
35
 2
2
111
20
238
 0.6
0.6
31
18
42
 4
4
207
117
1162
 0.7
0.7
34
15
33
 4
4
221
89
226
 7
7
373
110
308
 2
2
119
18
207
 1.3
1.3
68
21
158
 0.7
0.7
36
14
25
 0.4
0.4
18
15
27
 1.4
1.4
74
17
157
 18
18
912
67
1537
 0.4
0.4
22
22
23
 0.7
0.7
34
14
28
 2
2
91
15
104
 2
2
127
28
78
 16
16
814
18
581
 100
100
5127
37
11189
 4
4
197
107
419
 14
14
708
83
658
 1.1
1.1
56
48
81
Evolution
Species Conservation
PhosphoNET % Identity:
PhosphoNET % Similarity:
Homologene %
Identity:
PhosphoNET % Identity:
PhosphoNET % Similarity:
Homologene %
Identity:
 100
100
100
100 21.7
21.7
32.4
97.5 -
-
-
98 -
-
-
92 -
-
-
95 82
82
84.7
91 -
-
-
- 91.3
91.3
93.9
91 91.1
91.1
93.7
91 -
-
-
- -
-
-
- -
-
-
68 -
-
-
55 39.9
39.9
55.6
53 -
-
-
- -
-
-
26 -
-
-
- -
-
-
- -
-
-
- -
-
-
- -
-
-
- -
-
-
- -
-
-
- -
-
-
- -
-
-
-
For a wider analysis go to PhosphoNET Evolution in PhosphoNET
Regulation
Activation:
NA
Inhibition:
NA
Synthesis:
NA
Degradation:
Isoform 3 is quickly down-regulated in response to vascular injury, when ASMC cells change from a quiescent to a proliferative phenotype.
Protein Kinase Specificity
Matrix of observed frequency (%) of amino acids in aligned protein substrate phosphosites
Matrix Type:
Predicted from the application of the Kinexus Kinase Substrate Predictor Version 2.0 algorithm, which was trained with over 10,000 kinase-protein substrate pairs and 8,000 kinase-peptide substrate pairs.
Domain #:
2
Disease Linkage
General Disease Association:
Respiratory disorders
Specific Diseases (Non-cancerous):
Pharyngitis; Fasciitis; Necrotizing fasciitis; Centronuclear myopathy
Comments:
Pharyngitis (commonly called 'sore throat') is an upper respiratory tract disease characterized by inflammation of the pharynx resulting from a bacterial, viral, or fungal infection, or from irritants such as pollutants, chemical substances, or smoking. Symptoms include pain when swallowing, enlarged tonsils covered with white discharge, cough, and fever. Necrotizing fasciitis is characterized by a severe, sudden, and rapidly spreading bacterial infection of the skin, subcutaneous tissue, and fascis. The causal bacteria gains access to the body via an external injury. Symptoms of this disease include redness and inflammation at the infection site, high fever, severe pain, swelling, blisters, and (if not treated) multiple organ failure. Centronuclear myopathy (CNM) is a muscular disease characterized by muscle weakness and an increased proportion of muscle cells with centrally located nuclei. The most common form of CNM is X-linked myotubular myopathy, which is caused by inactivating mutations in MTM1, a lipid phosphatase. Through immunofluorescence and immunoprecipitation, the SPEG protein was identified as an MTM1-interacting protein, thus implicating the protein in the pathogenesis of CNM. In addition the SPEG protein is necessary for myocyte cytoskeletal development. In muscle cells, the SPEG protein is found in a double-line that flanks the protein desmin near the Z-lines of the sarcomere and is in alignment with the terminal cisternae of the sarcoplasmic reticulum. In animal studies, mice lacking SPEG expression display abnormal myocardial development and severe cardiomyopathy. Tissue samples from the mice revealed a significantly increased proportion of muscle cells with centrally located nuclei, resembling the CNM phenotype. Therefore, loss-of-function in the SPEG protein may play a critical role in the pathogenesis of CNM.
Gene Expression in Cancers:
TranscriptoNET (www.transcriptonet.ca) analysis with mRNA expression data retrieved from the National Center for Biotechnology Information's Gene Expression Omnibus (GEO) database, which was normalized against 60 abundantly and commonly found proteins, indicated altered expression for this protein kinase as shown here as the percent change from normal tissue controls (%CFC) as supported with the Student T-test in the following types of human cancers: Bladder carcinomas (%CFC= -57, p<0.001); Oral squamous cell carcinomas (OSCC) (%CFC= +117, p<0.056); Ovary adenocarcinomas (%CFC= +57, p<0.039); Pituitary adenomas (ACTH-secreting) (%CFC= -45); Skin melanomas - malignant (%CFC= -69, p<0.024); Uterine fibroids (%CFC= +81, p<0.002); and Uterine leiomyomas (%CFC= -77, p<0.003). The COSMIC website notes an up-regulated expression score for SPEG in diverse human cancers of 459, which is close to the average score of 462 for the human protein kinases. The down-regulated expression score of 0 for this protein kinase in human cancers was 100% lower than average score of 60 for the human protein kinases.
Mutagenesis Experiments:
Insertional mutagenesis studies in mice have not yet revealed a role for this protein kinase in mouse cancer oncogenesis.
Mutation Rate in All Cancers:
Percent mutation rates per 100 amino acids length in human cancers: 0.07 % in 24773 diverse cancer specimens. This rate is only -12 % lower than the average rate of 0.075 % calculated for human protein kinases in general.
Mutation Rate in Specific Cancers:
Highest percent mutation rates per 100 amino acids length in human cancers: 0.28 % in 864 skin cancers tested; 0.26 % in 1259 large intestine cancers tested; 0.24 % in 589 stomach cancers tested; 0.13 % in 603 endometrium cancers tested; 0.12 % in 1634 lung cancers tested; 0.09 % in 548 urinary tract cancers tested; 0.08 % in 238 bone cancers tested; 0.08 % in 1512 liver cancers tested; 0.06 % in 958 upper aerodigestive tract cancers tested; 0.06 % in 710 oesophagus cancers tested; 0.05 % in 1459 pancreas cancers tested; 0.04 % in 881 prostate cancers tested; 0.04 % in 833 ovary cancers tested; 0.04 % in 273 cervix cancers tested; 0.03 % in 2013 haematopoietic and lymphoid cancers tested; 0.03 % in 1305 breast cancers tested; 0.02 % in 558 thyroid cancers tested; 0.02 % in 441 autonomic ganglia cancers tested; 0.02 % in 2082 central nervous system cancers tested; 0.02 % in 1276 kidney cancers tested; 0.02 % in 127 biliary tract cancers tested; 0.01 % in 382 soft tissue cancers tested.
Frequency of Mutated Sites:
Most frequent mutations with the number of reports indicated in brackets: R3196Q (5); R3196* (2); R3021W (4); V2742M(3).
Comments:
Twenty-nine deletions, 3 insertions, and no complex mutations are noted on the COSMIC website.