
Nomenclature
Short Name:
SRM
Full Name:
Tyrosine-protein kinase Srms
Alias:
- SRMS
Classification
Type:
Protein-tyrosine kinase
Group:
TK
Family:
Src
SubFamily:
NA

Structure
Mol. Mass (Da):
54,507
# Amino Acids:
488
# mRNA Isoforms:
1
mRNA Isoforms:
54,507 Da (488 AA; Q9H3Y6)
4D Structure:
NA
1D Structure:
Subfamily Alignment
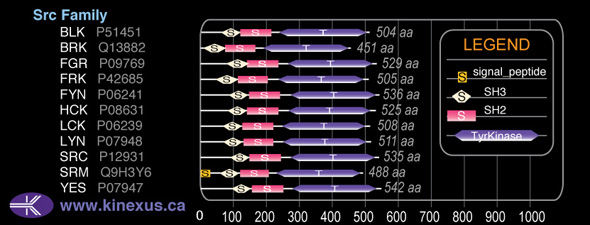
Domain Distribution:
| Start | End | Domain |
|---|---|---|
| 1 | 24 | signal_peptide |
| 51 | 112 | SH3 |
| 120 | 212 | SH2 |
| 230 | 488 | TyrKc |
| 230 | 482 | Pkinase |
Distribution
Based on gene microarray analysis from the NCBI
Human Tissue Distribution
% Max Expression:
Mean Expression:
Number of Samples:
Standard Deviation:
% Max Expression:
Mean Expression:
Number of Samples:
Standard Deviation:
 100
100
1379
6
1073
 0.9
0.9
13
4
9
 -
-
-
-
-
 1
1
16
26
7
 18
18
245
13
217
 0.5
0.5
7
9
5
 0.2
0.2
3
13
3
 1
1
18
3
6
 0.5
0.5
7
3
1
 2
2
26
27
16
 0.4
0.4
5
3
1
 42
42
585
9
434
 -
-
-
-
-
 0.6
0.6
8
3
6
 0.8
0.8
11
3
7
 0.7
0.7
10
5
3
 0.4
0.4
5
7
4
 0.7
0.7
9
3
3
 2
2
31
21
21
 23
23
317
31
211
 0.4
0.4
5
3
2
 0.4
0.4
5
3
1
 -
-
-
-
-
 0.2
0.2
3
3
2
 0.4
0.4
6
3
2
 30
30
409
19
403
 0.3
0.3
4
3
1
 0.4
0.4
5
3
1
 0.6
0.6
8
3
5
 5
5
72
14
44
 31
31
434
12
28
 3
3
43
11
50
 0.1
0.1
2
12
0
 39
39
543
26
469
 1
1
19
22
17
Evolution
Species Conservation
PhosphoNET % Identity:
PhosphoNET % Similarity:
Homologene %
Identity:
PhosphoNET % Identity:
PhosphoNET % Similarity:
Homologene %
Identity:
 100
100
100
100 98.7
98.7
99.1
100 94.3
94.3
95.9
95 -
-
-
79.5 -
-
-
- 59.9
59.9
65.9
80.5 -
-
-
- 77.8
77.8
85
79 41.2
41.2
55.5
80 -
-
-
- 68.6
68.6
81.5
- 40.7
40.7
56.8
64 39.6
39.6
53.9
53 23.4
23.4
33.5
46 -
-
-
- 41.9
41.9
57.6
- -
-
-
- -
-
-
- 42.4
42.4
57.9
- -
-
-
- -
-
-
- -
-
-
- -
-
-
- -
-
-
- -
-
-
-
For a wider analysis go to PhosphoNET Evolution in PhosphoNET
Regulation
Activation:
NA
Inhibition:
NA
Synthesis:
NA
Degradation:
NA
Protein Kinase Specificity
Matrix of observed frequency (%) of amino acids in aligned protein substrate phosphosites
Matrix Type:
Predicted from the application of the Kinexus Kinase Substrate Predictor Version 2.0 algorithm, which was trained with over 10,000 kinase-protein substrate pairs and 8,000 kinase-peptide substrate pairs.
Domain #:
1
Inhibitors
For further details on these inhibitors click on the Compound Name and enter it into DrugKiNET or click on the ID's
Based on in vitro and/or in vivo phosphorylation data
| Compound Name | KD, Ki or IC50 (nM) | PubChem ID | ChEMBL ID | PubMed ID |
|---|
Disease Linkage
General Disease Association:
Cancer
Specific Cancer Types:
Metanephric adenomas (MA)
Comments:
SRM is highly expressed in most breast cancers compared to normal mammary cell lines and tissues.
Gene Expression in Cancers:
The COSMIC website notes an up-regulated expression score for SRM in diverse human cancers of 590, which is 1.3-fold of the average score of 462 for the human protein kinases. The down-regulated expression score of 0 for this protein kinase in human cancers was 100% lower than average score of 60 for the human protein kinases.
Mutagenesis Experiments:
Insertional mutagenesis studies in mice have not yet revealed a role for this protein kinase in mouse cancer oncogenesis.
Mutation Rate in All Cancers:
Percent mutation rates per 100 amino acids length in human cancers: 0.07 % in 24914 diverse cancer specimens. This rate is only -7 % lower and is very similar to the average rate of 0.075 % calculated for human protein kinases in general.
Mutation Rate in Specific Cancers:
Highest percent mutation rates per 100 amino acids length in human cancers: 0.34 % in 1270 large intestine cancers tested; 0.24 % in 864 skin cancers tested; 0.2 % in 603 endometrium cancers tested; 0.19 % in 1822 lung cancers tested; 0.17 % in 589 stomach cancers tested; 0.13 % in 942 upper aerodigestive tract cancers tested; 0.11 % in 548 urinary tract cancers tested; 0.09 % in 238 bone cancers tested; 0.08 % in 273 cervix cancers tested; 0.05 % in 881 prostate cancers tested; 0.05 % in 382 soft tissue cancers tested; 0.04 % in 1512 liver cancers tested; 0.03 % in 710 oesophagus cancers tested; 0.03 % in 2082 central nervous system cancers tested; 0.03 % in 1316 breast cancers tested; 0.03 % in 1276 kidney cancers tested; 0.01 % in 1459 pancreas cancers tested.
Frequency of Mutated Sites:
Most frequent mutations with the number of reports indicated in brackets: R65W (3).
Comments:
No deletions, insertions or complex mutations are noted on the COSMIC website.