
Nomenclature
Short Name:
SgK223
Full Name:
FLJ00269
Alias:
- EC 2.7.10.2
- FLJ00269
- SG223
- Sugen kinase 223
Classification
Type:
Protein-serine/threonine kinase
Group:
Other
Family:
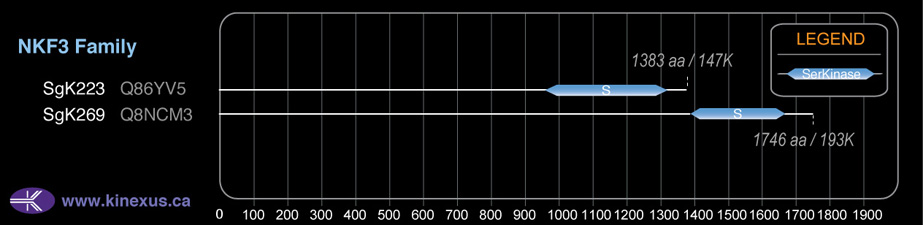
NKF3
SubFamily:
NA

Structure
Mol. Mass (Da):
149688
# Amino Acids:
1406
# mRNA Isoforms:
1
mRNA Isoforms:
149,624 Da (1406 AA; Q86YV5)
4D Structure:
NA
1D Structure:
Subfamily Alignment
Domain Distribution:
| Start | End | Domain |
|---|---|---|
| 1016 | 1325 | Pkinase |
Kinexus Products
Click on entries below for direct links to relevant products from Kinexus for this protein kinase.
hiddentext
Post-translation Modifications
For detailed information on phosphorylation of this kinase go to PhosphoNET
Acetylated:
K686, K693.
Serine phosphorylated:
S146, S148, S263, S285, S306, S313, S321, S361, S363, S414, S416, S490, S492, S493, S495, S507, S508, S510, S610, S651, S653, S692, S694, S696, S710, S712, S737, S738, S740, S743, S745, S747, S759, S776, S782, S786, S805, S807, S824, S826, S827, S837, S842, S844, S861, S863, S865, S867, S879, S907.
Threonine phosphorylated:
T160, T203, T317, T386, T517, T784, T840, T842, T1227.
Tyrosine phosphorylated:
Y79, Y132, Y159, Y197, Y253, Y363, Y365, Y411, Y413, Y487, Y489, Y862, Y864.
Distribution
Based on gene microarray analysis from the NCBI
Human Tissue Distribution
% Max Expression:
Mean Expression:
Number of Samples:
Standard Deviation:
% Max Expression:
Mean Expression:
Number of Samples:
Standard Deviation:
 30
30
1146
9
716
 1.4
1.4
55
1
0
 -
-
-
-
-
 5
5
180
29
116
 39
39
1495
10
431
 9
9
332
17
250
 7
7
288
10
74
 100
100
3856
4
4415
 -
-
-
-
-
 4
4
140
26
60
 0.8
0.8
30
2
21
 31
31
1202
8
638
 -
-
-
-
-
 -
-
-
-
-
 2
2
60
2
13
 1
1
40
5
16
 12
12
446
68
2902
 -
-
-
-
-
 6
6
218
18
65
 33
33
1261
28
647
 3
3
115
2
8
 9
9
344
2
11
 -
-
-
-
-
 -
-
-
-
-
 4
4
166
2
11
 28
28
1080
20
865
 -
-
-
-
-
 -
-
-
-
-
 -
-
-
-
-
 2
2
61
14
25
 -
-
-
-
-
 4
4
143
11
165
 31
31
1194
47
1260
 34
34
1313
26
1007
 14
14
547
22
653
Evolution
Species Conservation
PhosphoNET % Identity:
PhosphoNET % Similarity:
Homologene %
Identity:
PhosphoNET % Identity:
PhosphoNET % Similarity:
Homologene %
Identity:
 100
100
100
100 0
0
0
99 87.4
87.4
89.4
95 -
-
-
81 -
-
-
- 81.2
81.2
85.6
83 -
-
-
- 66.4
66.4
70.7
78 -
-
-
77.5 -
-
-
- 24.3
24.3
38.5
- 49.9
49.9
60.3
55 42.2
42.2
55.3
55 27.6
27.6
41.1
- -
-
-
- -
-
-
- -
-
-
- -
-
-
- 21.3
21.3
31.2
- -
-
-
- -
-
-
- -
-
-
- -
-
-
- -
-
-
- -
-
-
-
For a wider analysis go to PhosphoNET Evolution in PhosphoNET
Regulation
Activation:
NA
Inhibition:
NA
Synthesis:
NA
Degradation:
NA
Protein Kinase Specificity
Matrix of observed frequency (%) of amino acids in aligned protein substrate phosphosites
Matrix Type:
Predicted from the application of the Kinexus Kinase Substrate Predictor Version 2.0 algorithm, which was trained with over 10,000 kinase-protein substrate pairs and 8,000 kinase-peptide substrate pairs.
Domain #:
1
Disease Linkage
General Disease Association:
Cancer
Specific Cancer Types:
Colon cancer
Gene Expression in Cancers:
TranscriptoNET (www.transcriptonet.ca) analysis with mRNA expression data retrieved from the National Center for Biotechnology Information's Gene Expression Omnibus (GEO) database, which was normalized against 60 abundantly and commonly found proteins, indicated altered expression for this protein kinase as shown here as the percent change from normal tissue controls (%CFC) as supported with the Student T-test in the following types of human cancers: Classical Hodgkin lymphomas (%CFC= -45, p<0.066); Papillary thyroid carcinomas (PTC) (%CFC= -60, p<0.006); Prostate cancer - metastatic (%CFC= +47, p<0.042); and Vulvar intraepithelial neoplasia (%CFC= +61, p<0.009).
Mutagenesis Experiments:
Insertional mutagenesis studies in mice have not yet revealed a role for this protein kinase in mouse cancer oncogenesis.
Mutation Rate in All Cancers:
Frequency of Mutated Sites:
None > 3 in 19,758 cancer specimens