
Nomenclature
Short Name:
TAO3
Full Name:
Serine-threonine-protein kinase TAO3
Alias:
- DPK
- EC 2.7.11.1
- TAOK3
- JIK
- Kinase TAO3
- MAP3K18
- TAO kinase 3
Classification
Type:
Protein-serine/threonine kinase
Group:
STE
Family:
STE20
SubFamily:
TAO

Structure
Mol. Mass (Da):
105,406
# Amino Acids:
898
# mRNA Isoforms:
1
mRNA Isoforms:
105,406 Da (898 AA; Q9H2K8)
4D Structure:
Self-associates.
1D Structure:
Subfamily Alignment
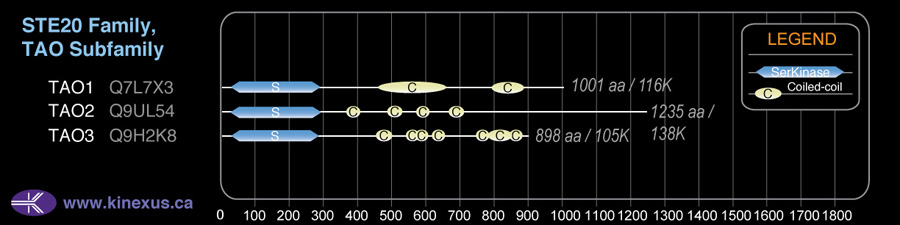
Domain Distribution:
| Start | End | Domain |
|---|---|---|
| 24 | 277 | Pkinase |
| 454 | 499 | Coiled-coil |
| 549 | 569 | Coiled-coil |
| 575 | 595 | Coiled-coil |
| 621 | 643 | Coiled-coil |
| 758 | 778 | Coiled-coil |
| 795 | 834 | Coiled-coil |
| 839 | 878 | Coiled-coil |
Kinexus Products
Click on entries below for direct links to relevant products from Kinexus for this protein kinase.
hiddentext
Post-translation Modifications
For detailed information on phosphorylation of this kinase go to PhosphoNET
Serine phosphorylated:
S173+, S177+, S324+, S331, S336, S354, S359, S442, S551, S782.
Threonine phosphorylated:
T181+, T316, T335, T357, T437, T573, T745.
Tyrosine phosphorylated:
Y103, Y305, Y429, Y897.
Distribution
Based on gene microarray analysis from the NCBI
Human Tissue Distribution
% Max Expression:
Mean Expression:
Number of Samples:
Standard Deviation:
% Max Expression:
Mean Expression:
Number of Samples:
Standard Deviation:
 44
44
860
29
919
 3
3
56
16
41
 16
16
318
22
331
 29
29
563
113
837
 49
49
945
25
683
 3
3
63
74
45
 24
24
464
35
508
 66
66
1292
59
3081
 36
36
702
17
625
 7
7
142
108
170
 8
8
152
47
174
 30
30
577
200
601
 14
14
267
44
364
 4
4
78
15
71
 10
10
186
40
268
 6
6
107
16
90
 7
7
134
219
241
 11
11
216
31
214
 5
5
103
103
115
 34
34
659
109
679
 14
14
273
41
375
 11
11
213
45
257
 18
18
342
24
321
 7
7
134
33
149
 12
12
224
41
275
 39
39
749
72
1099
 11
11
217
47
251
 7
7
133
33
152
 12
12
231
33
285
 3
3
51
28
40
 19
19
367
24
227
 100
100
1943
36
4002
 5
5
95
74
164
 51
51
983
52
656
 7
7
141
35
125
Evolution
Species Conservation
PhosphoNET % Identity:
PhosphoNET % Similarity:
Homologene %
Identity:
PhosphoNET % Identity:
PhosphoNET % Similarity:
Homologene %
Identity:
 100
100
100
100 92.3
92.3
92.4
94 25.3
25.3
37
- -
-
-
98 -
-
-
76 98.3
98.3
99.2
98 -
-
-
- 95.5
95.5
97.7
95.5 95.3
95.3
97.9
95 -
-
-
- 66.3
66.3
77.8
- 94
94
97.7
94 89.4
89.4
95.2
64 24.9
24.9
37.9
84.5 -
-
-
- 25.1
25.1
41.6
- -
-
-
- 38
38
57
- -
-
-
- -
-
-
- -
-
-
- -
-
-
- -
-
-
- -
-
-
- -
-
-
-
For a wider analysis go to PhosphoNET Evolution in PhosphoNET
Regulation
Activation:
NA
Inhibition:
NA
Synthesis:
NA
Degradation:
NA
Protein Kinase Specificity
Matrix of observed frequency (%) of amino acids in aligned protein substrate phosphosites
Matrix Type:
Predicted from the application of the Kinexus Kinase Substrate Predictor Version 2.0 algorithm, which was trained with over 10,000 kinase-protein substrate pairs and 8,000 kinase-peptide substrate pairs.
Domain #:
1
Inhibitors
For further details on these inhibitors click on the Compound Name and enter it into DrugKiNET or click on the ID's
Based on in vitro and/or in vivo phosphorylation data
| Compound Name | KD, Ki or IC50 (nM) | PubChem ID | ChEMBL ID | PubMed ID |
|---|
Disease Linkage
Comments:
TAO3 was found to link with morphine requirement and postoperative pain in a retrospective pediatric day surgery population.
Gene Expression in Cancers:
TranscriptoNET (www.transcriptonet.ca) analysis with mRNA expression data retrieved from the National Center for Biotechnology Information's Gene Expression Omnibus (GEO) database, which was normalized against 60 abundantly and commonly found proteins, indicated altered expression for this protein kinase as shown here as the percent change from normal tissue controls (%CFC) as supported with the Student T-test in the following types of human cancers: Bladder carcinomas (%CFC= +65, p<0.0004); Brain oligodendrogliomas (%CFC= -83, p<0.084); Uterine fibroids (%CFC= +72, p<0.001); and Uterine leiomyomas from fibroids (%CFC= +102, p<0.001). The COSMIC website notes an up-regulated expression score for TAO3 in diverse human cancers of 342, which is 0.7-fold of the average score of 462 for the human protein kinases. The down-regulated expression score of 111 for this protein kinase in human cancers was 1.9-fold of the average score of 60 for the human protein kinases.
Mutagenesis Experiments:
Insertional mutagenesis studies in mice support a role for this protein kinase in mouse cancer oncogenesis.
Mutation Rate in All Cancers:
Percent mutation rates per 100 amino acids length in human cancers: 0.06 % in 24900 diverse cancer specimens. This rate is only -23 % lower than the average rate of 0.075 % calculated for human protein kinases in general.
Mutation Rate in Specific Cancers:
Highest percent mutation rates per 100 amino acids length in human cancers: 0.29 % in 575 stomach cancers tested; 0.26 % in 1270 large intestine cancers tested; 0.16 % in 273 cervix cancers tested; 0.14 % in 1634 lung cancers tested; 0.13 % in 864 skin cancers tested; 0.11 % in 710 oesophagus cancers tested; 0.11 % in 603 endometrium cancers tested; 0.09 % in 127 biliary tract cancers tested; 0.08 % in 548 urinary tract cancers tested; 0.07 % in 1512 liver cancers tested; 0.05 % in 238 bone cancers tested; 0.04 % in 2082 central nervous system cancers tested; 0.04 % in 1316 breast cancers tested; 0.03 % in 833 ovary cancers tested; 0.03 % in 1276 kidney cancers tested; 0.02 % in 2009 haematopoietic and lymphoid cancers tested; 0.01 % in 1459 pancreas cancers tested.
Frequency of Mutated Sites:
Most frequent mutations with the number of reports indicated in brackets: P20T (3).
Comments:
Only 2 insertions and no insertions or complex mutations are noted on the COSMIC website.