
Nomenclature
Short Name:
TRIO
Full Name:
Triple functional domain protein
Alias:
- EC 2.7.11.1
- ERBB1
- PTPRF interacting protein
- PTPRF-interacting protein
- Triple functional domain (PTPRF interacting)
Classification
Type:
Protein-serine/threonine kinase
Group:
CAMK
Family:
Trio
SubFamily:
NA

Specific Links
Structure
Mol. Mass (Da):
346900
# Amino Acids:
3097
# mRNA Isoforms:
5
mRNA Isoforms:
346,900 Da (3097 AA; O75962); 341,598 Da (3038 AA; O75962-4); 329,389 Da (2921 AA; O75962-2); 287,377 Da (2563 AA; O75962-5); 66,206 Da (596 AA; O75962-3)
4D Structure:
Interacts to form a complex with leukocyte antigen related protein.
1D Structure:
Subfamily Alignment
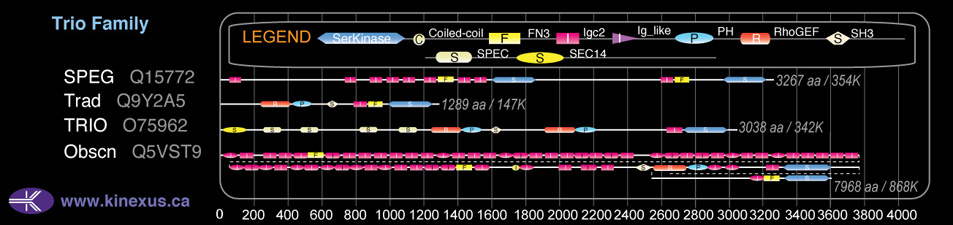
Domain Distribution:
Post-translation Modifications
For detailed information on phosphorylation of this kinase go to PhosphoNET
Acetylated:
K265, K681, K1808, K2481, K2640.
Serine phosphorylated:
S116, S297, S299, S520, S1459, S1627, S1633, S1704, S1724, S1745, S1749, S1752, S1779, S1785, S1786, S1809, S1814, S1818, S1821, S1847, S1854, S1900, S1901, S2208, S2255, S2282, S2302, S2326, S2388, S2391, S2417, S2429, S2440, S2455, S2459, S2462, S2467, S2476, S2477, S2492, S2495, S2508, S2631, S2671, S2794.
Threonine phosphorylated:
T517, T525, T724, T1545, T1700, T1778, T1824, T1899, T1903, T2513, T2625.
Tyrosine phosphorylated:
Y1228, Y2058, Y2075, Y2286, Y2659, Y2796.
Ubiquitinated:
K1131.
Distribution
Based on gene microarray analysis from the NCBI
Human Tissue Distribution
% Max Expression:
Mean Expression:
Number of Samples:
Standard Deviation:
% Max Expression:
Mean Expression:
Number of Samples:
Standard Deviation:
 86
86
960
106
1088
 6
6
63
44
54
 94
94
1040
63
947
 45
45
502
384
780
 63
63
703
95
595
 33
33
369
291
2108
 12
12
133
115
375
 100
100
1111
160
2019
 27
27
298
52
191
 13
13
144
337
356
 20
20
217
120
393
 68
68
761
550
652
 32
32
353
140
654
 7
7
78
30
91
 36
36
401
101
674
 4
4
43
61
43
 33
33
369
440
2136
 30
30
338
84
470
 16
16
174
345
371
 43
43
474
430
523
 45
45
497
94
846
 44
44
488
108
684
 59
59
653
78
775
 35
35
384
84
467
 36
36
397
94
620
 99
99
1100
246
2502
 25
25
275
143
486
 35
35
393
84
638
 68
68
758
84
907
 7
7
80
126
116
 14
14
161
54
283
 50
50
558
127
570
 11
11
127
172
510
 77
77
861
239
723
 6
6
72
126
89
Evolution
Species Conservation
PhosphoNET % Identity:
PhosphoNET % Similarity:
Homologene %
Identity:
PhosphoNET % Identity:
PhosphoNET % Similarity:
Homologene %
Identity:
 100
100
100
100 92
92
92.2
99 -
-
-
99 -
-
-
96 -
-
-
- 95.1
95.1
96.6
96.5 -
-
-
- 96.4
96.4
97.8
96.5 60.5
60.5
74.7
96 -
-
-
- 93.3
93.3
95.5
- 92.5
92.5
95.2
95 -
-
-
90 81.7
81.7
89.2
84 -
-
-
- 34
34
49.3
47 -
-
-
- -
-
-
32 -
-
-
- -
-
-
- -
-
-
- -
-
-
- -
-
-
- -
-
-
- -
-
-
-
For a wider analysis go to PhosphoNET Evolution in PhosphoNET
Binding Proteins
Examples of known interacting proteins
hiddentext
| No. | Name – UniProt ID |
|---|---|
| 1 | BLMH - Q13867 |
| 2 | PAM - P19021 |
Regulation
Activation:
NA
Inhibition:
NA
Synthesis:
NA
Degradation:
NA
Protein Kinase Specificity
Matrix of observed frequency (%) of amino acids in aligned protein substrate phosphosites
Matrix Type:
Predicted from the application of the Kinexus Kinase Substrate Predictor Version 2.0 algorithm, which was trained with over 10,000 kinase-protein substrate pairs and 8,000 kinase-peptide substrate pairs.
Domain #:
1
Inhibitors
For further details on these inhibitors click on the Compound Name and enter it into DrugKiNET or click on the ID's
Based on in vitro and/or in vivo phosphorylation data
| Compound Name | KD, Ki or IC50 (nM) | PubChem ID | ChEMBL ID | PubMed ID |
|---|
Disease Linkage
Gene Expression in Cancers:
TranscriptoNET (www.transcriptonet.ca) analysis with mRNA expression data retrieved from the National Center for Biotechnology Information's Gene Expression Omnibus (GEO) database, which was normalized against 60 abundantly and commonly found proteins, indicated altered expression for this protein kinase as shown here as the percent change from normal tissue controls (%CFC) as supported with the Student T-test in the following types of human cancers: Brain glioblastomas (%CFC= -69, p<0.063); Brain oligodendrogliomas (%CFC= -100, p<0.009); Cervical cancer (%CFC= -61, p<0.0001); Head and neck squamous cell carcinomas (HNSCC) (%CFC= +57, p<0.0001); Oral squamous cell carcinomas (OSCC) (%CFC= +169, p<0.0001); Prostate cancer - metastatic (%CFC= +73, p<0.0001); Skin fibrosarcomas (%CFC= +246, p<0.004). The COSMIC website notes an up-regulated expression score for TRIO in diverse human cancers of 746, which is 1.6-fold of the average score of 462 for the human protein kinases. The down-regulated expression score of 26 for this protein kinase in human cancers was 0.4-fold of the average score of 60 for the human protein kinases.
Mutagenesis Experiments:
Insertional mutagenesis studies in mice have not yet revealed a role for this protein kinase in mouse cancer oncogenesis. Mutations at amino acid residues 1299, 1303, 1389, 1426, 1427, 1428, 1430, 1431, 1434, 1437 and 1438 in TRIO can render different extents of loss of nucleotide exchange activity.
Mutation Rate in All Cancers:
Percent mutation rates per 100 amino acids length in human cancers: 0.06 % in 25182 diverse cancer specimens. This rate is only -14 % lower than the average rate of 0.075 % calculated for human protein kinases in general.
Mutation Rate in Specific Cancers:
Highest percent mutation rates per 100 amino acids length in human cancers: 0.26 % in 1361 large intestine cancers tested; 0.23 % in 589 stomach cancers tested; 0.21 % in 864 skin cancers tested; 0.16 % in 603 endometrium cancers tested; 0.13 % in 1635 lung cancers tested; 0.1 % in 1512 liver cancers tested; 0.08 % in 548 urinary tract cancers tested; 0.07 % in 757 oesophagus cancers tested; 0.06 % in 1316 breast cancers tested; 0.04 % in 881 prostate cancers tested; 0.04 % in 833 ovary cancers tested; 0.04 % in 273 cervix cancers tested; 0.04 % in 1078 upper aerodigestive tract cancers tested; 0.03 % in 558 thyroid cancers tested; 0.03 % in 441 autonomic ganglia cancers tested; 0.03 % in 1459 pancreas cancers tested; 0.03 % in 1448 kidney cancers tested; 0.02 % in 2082 central nervous system cancers tested; 0.02 % in 2009 haematopoietic and lymphoid cancers tested.
Frequency of Mutated Sites:
Most frequent mutations with the number of reports indicated in brackets: R2876C (5); R662H (3); R1276• (3); R1502* (3); R1428Q (3).
Comments:
Over 30 deletions, 11 insertions and 2 complex mutations are noted on the COSMIC website.