
Nomenclature
Short Name:
ULK2
Full Name:
Serine-threonine-protein kinase ULK2
Alias:
- EC 2.7.11.1
- KIAA0623
- Unc51.2
- Unc-51-like kinase 2
Classification
Type:
Protein-serine/threonine kinase
Group:
Other
Family:
ULK
SubFamily:
NA

Structure
Mol. Mass (Da):
112694
# Amino Acids:
1036
# mRNA Isoforms:
1
mRNA Isoforms:
112,694 Da (1036 AA; Q8IYT8)
4D Structure:
Interacts (via C-terminus) with ATG13/KIAA0652.
1D Structure:
Subfamily Alignment
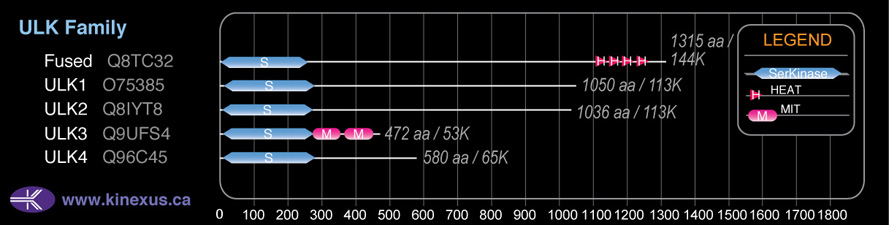
Domain Distribution:
| Start | End | Domain |
|---|---|---|
| 9 | 271 | Pkinase |
Kinexus Products
Click on entries below for direct links to relevant products from Kinexus for this protein kinase.
hiddentext
Post-translation Modifications
For detailed information on phosphorylation of this kinase go to PhosphoNET
Acetylated:
K922.
Serine phosphorylated:
S104, S148, S150, S323, S574, S771, S1027.
Threonine phosphorylated:
T425, T576, T826, T844.
Tyrosine phosphorylated:
Y331, Y1018.
Distribution
Based on gene microarray analysis from the NCBI
Human Tissue Distribution
% Max Expression:
Mean Expression:
Number of Samples:
Standard Deviation:
% Max Expression:
Mean Expression:
Number of Samples:
Standard Deviation:
 37
37
847
51
908
 2
2
38
23
24
 5
5
122
19
116
 16
16
374
171
460
 28
28
641
42
499
 1.1
1.1
25
120
17
 7
7
162
57
360
 18
18
411
58
503
 13
13
292
24
221
 3
3
73
131
95
 2
2
48
46
53
 28
28
636
267
649
 2
2
54
52
56
 2
2
41
18
21
 3
3
68
39
96
 2
2
42
28
19
 9
9
208
230
1824
 4
4
97
31
131
 4
4
87
133
73
 20
20
456
185
466
 11
11
261
36
291
 3
3
61
42
60
 5
5
111
22
99
 13
13
289
32
371
 3
3
60
35
75
 29
29
669
104
1147
 3
3
64
55
162
 4
4
92
32
109
 5
5
105
32
115
 5
5
122
42
75
 21
21
475
30
516
 100
100
2305
56
5396
 8
8
183
113
502
 34
34
787
104
639
 23
23
541
61
691
Evolution
Species Conservation
PhosphoNET % Identity:
PhosphoNET % Similarity:
Homologene %
Identity:
PhosphoNET % Identity:
PhosphoNET % Similarity:
Homologene %
Identity:
 100
100
100
100 99.3
99.3
99.6
99 94.6
94.6
95.8
98 -
-
-
- -
-
-
- -
-
-
95 -
-
-
- 93.6
93.6
96.1
94 22.1
22.1
38.1
94 -
-
-
- 86.7
86.7
92.2
- 20.9
20.9
30.8
87 20.9
20.9
31.9
80 75.6
75.6
85.4
76 -
-
-
- 35.3
35.3
50.2
32 38.5
38.5
51.7
- 33.1
33.1
48.8
31 -
-
-
- -
-
-
- -
-
-
- -
-
-
- -
-
-
- -
-
-
- -
-
-
-
For a wider analysis go to PhosphoNET Evolution in PhosphoNET
Binding Proteins
Examples of known interacting proteins
hiddentext
| No. | Name – UniProt ID |
|---|---|
| 1 | SYNGAP1 - Q96PV0 |
Regulation
Activation:
NA
Inhibition:
NA
Synthesis:
NA
Degradation:
NA
Protein Kinase Specificity
Matrix of observed frequency (%) of amino acids in aligned protein substrate phosphosites
Matrix Type:
Predicted from the application of the Kinexus Kinase Substrate Predictor Version 2.0 algorithm, which was trained with over 10,000 kinase-protein substrate pairs and 8,000 kinase-peptide substrate pairs.
Domain #:
1
Inhibitors
For further details on these inhibitors click on the Compound Name and enter it into DrugKiNET or click on the ID's
Based on in vitro and/or in vivo phosphorylation data
| Compound Name | KD, Ki or IC50 (nM) | PubChem ID | ChEMBL ID | PubMed ID |
|---|
Disease Linkage
Gene Expression in Cancers:
TranscriptoNET (www.transcriptonet.ca) analysis with mRNA expression data retrieved from the National Center for Biotechnology Information's Gene Expression Omnibus (GEO) database, which was normalized against 60 abundantly and commonly found proteins, indicated altered expression for this protein kinase as shown here as the percent change from normal tissue controls (%CFC) as supported with the Student T-test in the following types of human cancers: Breast epithelial carcinomas (%CFC= -50, p<0.047); and Breast epithelial hyperplastic enlarged lobular units (HELU) (%CFC= +131, p<0.012).
Mutagenesis Experiments:
Insertional mutagenesis studies in mice have not yet revealed a role for this protein kinase in mouse cancer oncogenesis. A K39R mutation in ULK2 can inhibit its phosphotransferase activity and decrease autophosphorylation.
Mutation Rate in All Cancers:
Percent mutation rates per 100 amino acids length in human cancers: 0.06 % in 24433 diverse cancer specimens. This rate is only -24 % lower than the average rate of 0.075 % calculated for human protein kinases in general.
Mutation Rate in Specific Cancers:
Highest percent mutation rates per 100 amino acids length in human cancers: 0.2 % in 864 skin cancers tested; 0.19 % in 603 endometrium cancers tested; 0.18 % in 589 stomach cancers tested; 0.17 % in 1270 large intestine cancers tested; 0.15 % in 65 Meninges cancers tested; 0.12 % in 548 urinary tract cancers tested; 0.11 % in 273 cervix cancers tested; 0.08 % in 1512 liver cancers tested; 0.07 % in 710 oesophagus cancers tested; 0.06 % in 1634 lung cancers tested; 0.05 % in 1316 breast cancers tested; 0.04 % in 238 bone cancers tested; 0.03 % in 942 upper aerodigestive tract cancers tested; 0.03 % in 382 soft tissue cancers tested; 0.03 % in 2082 central nervous system cancers tested; 0.02 % in 1276 kidney cancers tested; 0.01 % in 881 prostate cancers tested; 0.01 % in 2009 haematopoietic and lymphoid cancers tested; 0.01 % in 1459 pancreas cancers tested;
Frequency of Mutated Sites:
Most frequent mutations with the number of reports indicated in brackets: R821W (4); P702L (3).
Comments:
Only 7 deletions, 4 insertions and no complex mutations are noted on the COSMIC website.