
Nomenclature
Short Name:
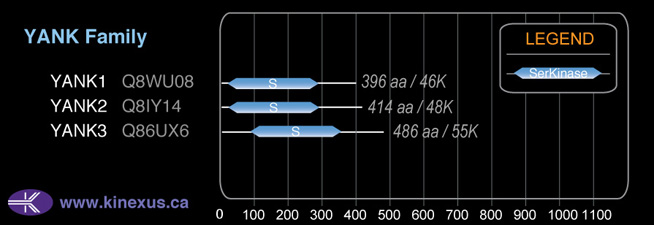
YANK2
Full Name:
Serine/threonine-protein kinase 32B
Alias:
- STK32B
- HSA250839
Classification
Type:
Protein-serine/threonine kinase
Group:
AGC
Family:
YANK
SubFamily:
NA

Structure
Mol. Mass (Da):
47,883
# Amino Acids:
414
# mRNA Isoforms:
2
mRNA Isoforms:
47,883 Da (414 AA; Q9NY57); 42,561 Da (367 AA; Q9NY57-2)
4D Structure:
NA
1D Structure:
Subfamily Alignment
Domain Distribution:
| Start | End | Domain |
|---|---|---|
| 23 | 283 | Pkinase |
Post-translation Modifications
For detailed information on phosphorylation of this kinase go to PhosphoNET
Serine phosphorylated:
S378.
Tyrosine phosphorylated:
Y49.
Distribution
Based on gene microarray analysis from the NCBI
Human Tissue Distribution
% Max Expression:
Mean Expression:
Number of Samples:
Standard Deviation:
% Max Expression:
Mean Expression:
Number of Samples:
Standard Deviation:
 57
57
916
16
1653
 28
28
451
10
984
 9
9
145
12
195
 21
21
334
57
641
 32
32
519
14
559
 0.3
0.3
5
37
8
 0.3
0.3
5
15
5
 47
47
753
28
1349
 10
10
161
10
165
 12
12
185
46
407
 13
13
210
24
570
 41
41
651
87
666
 7
7
108
24
259
 56
56
892
8
1940
 18
18
280
22
784
 18
18
282
9
556
 12
12
198
87
576
 15
15
235
19
533
 16
16
254
49
1144
 25
25
397
58
876
 13
13
210
21
471
 3
3
43
20
57
 8
8
124
13
170
 45
45
726
20
1476
 16
16
262
21
315
 100
100
1597
39
3461
 9
9
139
28
403
 18
18
283
19
699
 15
15
232
19
524
 4
4
58
14
16
 42
42
673
18
489
 72
72
1155
23
1619
 0.2
0.2
3
54
16
 46
46
733
26
640
 21
21
330
22
184
Evolution
Species Conservation
PhosphoNET % Identity:
PhosphoNET % Similarity:
Homologene %
Identity:
PhosphoNET % Identity:
PhosphoNET % Similarity:
Homologene %
Identity:
 100
100
100
100 55.9
55.9
68.1
92 97.3
97.3
98.3
97 -
-
-
95 -
-
-
- 80.5
80.5
85.3
93 -
-
-
- 92
92
95.6
92 28
28
48.3
91 -
-
-
- 58
58
62.5
- 21.9
21.9
33.6
88 22.1
22.1
34.1
83 22
22
34.5
67 -
-
-
- 29.7
29.7
48.7
56 50.2
50.2
61.5
- -
-
-
47 58.2
58.2
72.4
- -
-
-
- -
-
-
- -
-
-
- -
-
-
- -
-
-
- -
-
-
-
For a wider analysis go to PhosphoNET Evolution in PhosphoNET
Regulation
Activation:
NA
Inhibition:
NA
Synthesis:
NA
Degradation:
NA
Protein Kinase Specificity
Matrix of observed frequency (%) of amino acids in aligned protein substrate phosphosites
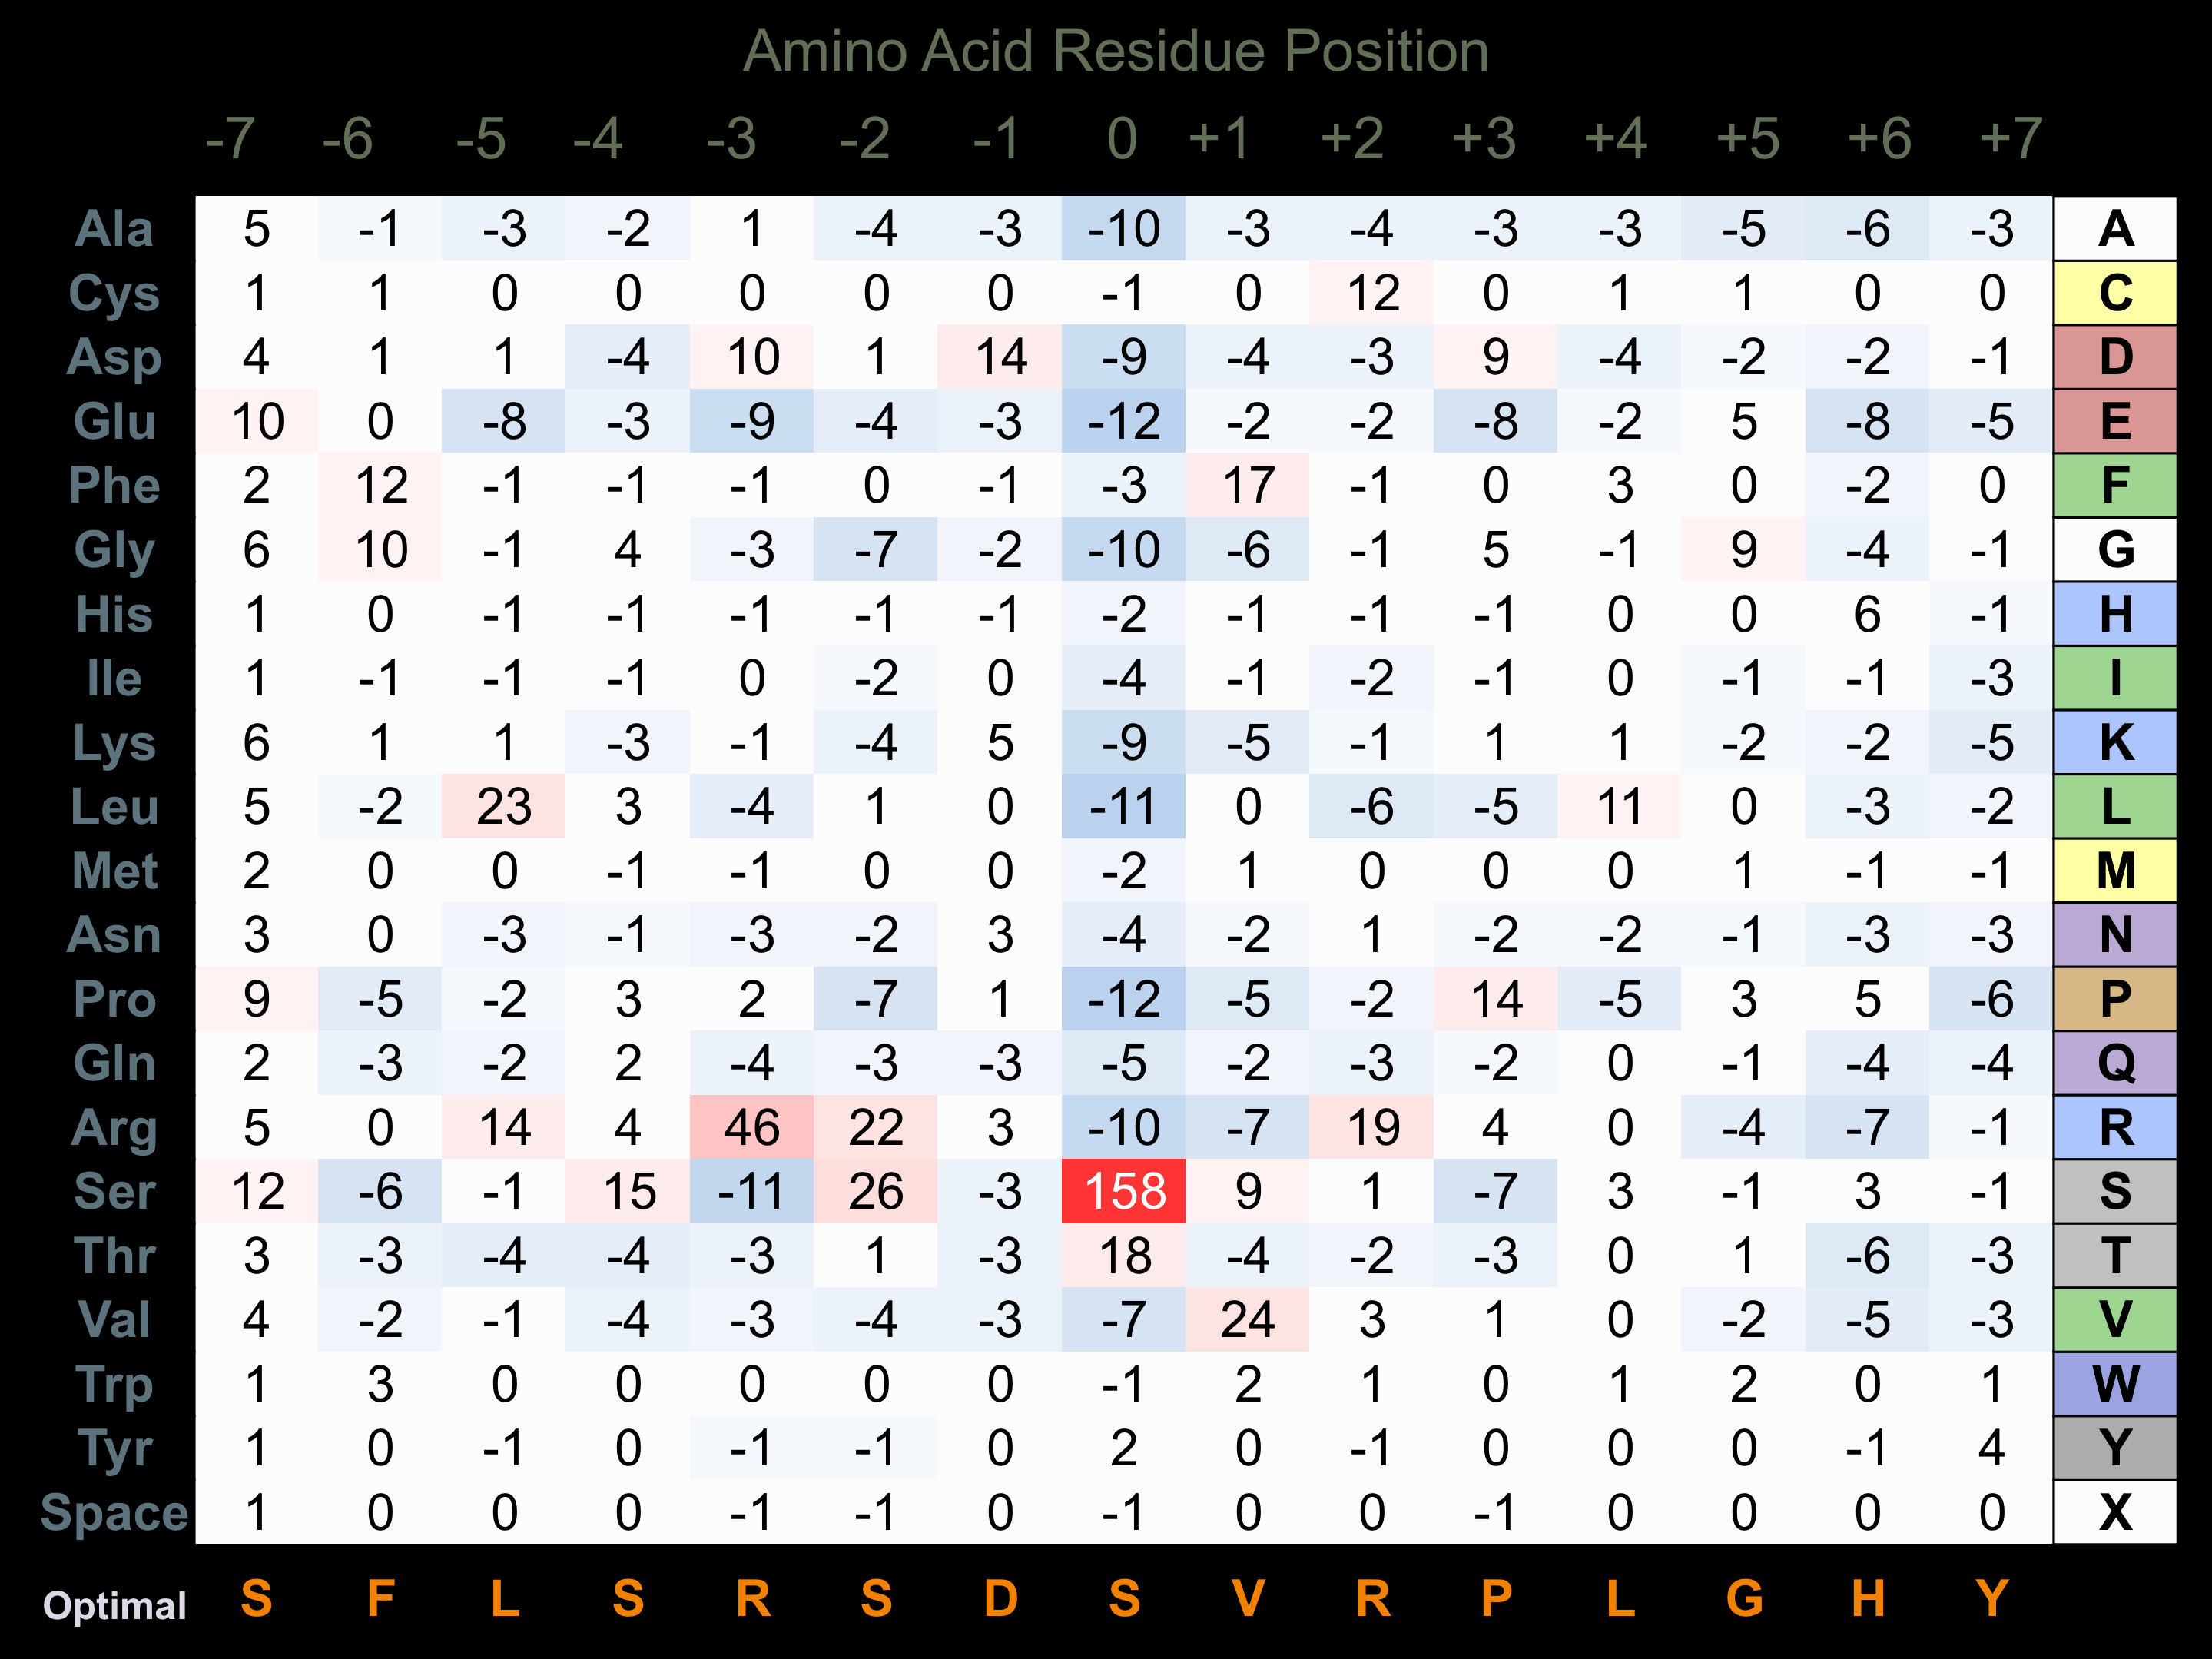
Matrix Type:
Predicted from the application of the Kinexus Kinase Substrate Predictor Version 2.0 algorithm, which was trained with over 10,000 kinase-protein substrate pairs and 8,000 kinase-peptide substrate pairs.
Domain #:
1
Inhibitors
For further details on these inhibitors click on the Compound Name and enter it into DrugKiNET or click on the ID's
Based on in vitro and/or in vivo phosphorylation data
| Compound Name | KD, Ki or IC50 (nM) | PubChem ID | ChEMBL ID | PubMed ID |
|---|
| NVP-TAE684 | Kd = 24 nM | 16038120 | 509032 | 22037378 |
| Staurosporine | Kd = 98 nM | 5279 | 18183025 | |
| Linifanib | Kd = 270 nM | 11485656 | 223360 | 18183025 |
| WZ3146 | Kd > 1 µM | 44607360 | 20033049 | |
| WZ4002 | Kd > 1 µM | 44607530 | 20033049 | |
| PD173955 | Kd = 1.2 µM | 447077 | 386051 | 22037378 |
| SureCN7018367 | Kd < 1.25 µM | 18792927 | 450519 | 19035792 |
| PP242 | Kd = 1.4 µM | 25243800 | 22037378 | |
| SB203580 | Kd = 2.1 µM | 176155 | 10 | 18183025 |
| Brivanib | Kd = 3.9 µM | 11234052 | 377300 | 22037378 |
| SB202190 | Kd = 4.9 µM | 5353940 | 278041 | 18183025 |
Disease Linkage
Gene Expression in Cancers:
The COSMIC website notes an up-regulated expression score for YANK2 in diverse human cancers of 411, which is 0.9-fold of the average score of 462 for the human protein kinases. The down-regulated expression score of 0 for this protein kinase in human cancers was 100% lower than the average score of 60 for the human protein kinases.
Mutagenesis Experiments:
Insertional mutagenesis studies in mice have not yet revealed a role for this protein kinase in mouse cancer oncogenesis.
Mutation Rate in All Cancers:
Percent mutation rates per 100 amino acids length in human cancers: 0.13 % in 24970 diverse cancer specimens. This rate is 1.2-fold higher than the average rate of 0.075 % calculated for human protein kinases in general.
Mutation Rate in Specific Cancers:
Highest percent mutation rates per 100 amino acids length in human cancers: 0.7 % in 589 stomach cancers tested; 0.61 % in 1270 large intestine cancers tested; 0.39 % in 864 skin cancers tested; 0.36 % in 603 endometrium cancers tested; 0.26 % in 1512 liver cancers tested; 0.24 % in 1822 lung cancers tested; 0.1 % in 942 upper aerodigestive tract cancers tested; 0.1 % in 238 bone cancers tested; 0.1 % in 1459 pancreas cancers tested; 0.09 % in 273 cervix cancers tested; 0.07 % in 710 oesophagus cancers tested; 0.05 % in 2082 central nervous system cancers tested; 0.05 % in 1372 breast cancers tested; 0.04 % in 558 thyroid cancers tested; 0.04 % in 548 urinary tract cancers tested; 0.04 % in 1276 kidney cancers tested.
Frequency of Mutated Sites:
Most frequent mutations with the number of reports indicated in brackets: R27W (4); G212S (3); R336K (3); .
Comments:
Only 1 deletion, and no insertions or complex mutations are noted on the COSMIC website.