
Nomenclature
Short Name:
YSK4
Full Name:
Mitogen-activated protein kinase kinase kinase 8
Alias:
- FLJ23074
- Rck
- Regulated in COPD, protein kinase
- Ysk4
- YSK4 Sps1/Ste20-related kinase
Classification
Type:
Protein-serine/threonine kinase
Group:
STE
Family:
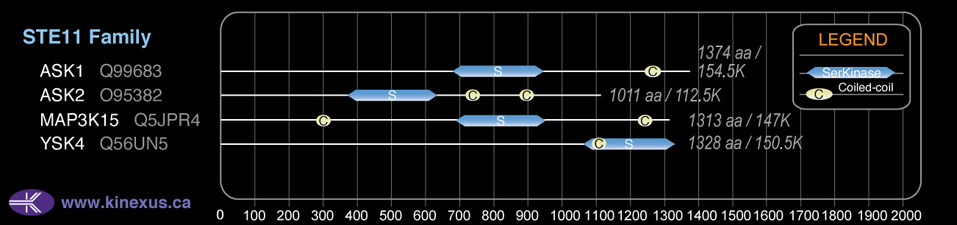
STE11
SubFamily:
NA

Structure
Mol. Mass (Da):
150,537
# Amino Acids:
1328
# mRNA Isoforms:
7
mRNA Isoforms:
150,537 Da (1328 AA; Q56UN5); 137,548 Da (1215 AA; Q56UN5-3); 127,941 Da (1127 AA; Q56UN5-2); 57,659 Da (510 AA; Q56UN5-5); 52,504 Da (462 AA; Q56UN5-4); 51,920 Da (460 AA; Q56UN5-7); 18,702 Da (168 AA; Q56UN5-6)
4D Structure:
NA
1D Structure:
Subfamily Alignment
Domain Distribution:
| Start | End | Domain |
|---|---|---|
| 1061 | 1324 | Pkinase |
| 1098 | 1118 | Coiled-coil |
Kinexus Products
Click on entries below for direct links to relevant products from Kinexus for this protein kinase.
hiddentext
Post-translation Modifications
For detailed information on phosphorylation of this kinase go to PhosphoNET
Serine phosphorylated:
S219, S251, S417, S1096.
Threonine phosphorylated:
T223, T242, T668, T1095.
Ubiquitinated:
K509, K530.
Distribution
Based on gene microarray analysis from the NCBI
Human Tissue Distribution
% Max Expression:
Mean Expression:
Number of Samples:
Standard Deviation:
% Max Expression:
Mean Expression:
Number of Samples:
Standard Deviation:
 91
91
832
22
1567
 2
2
14
9
17
 8
8
71
1
0
 22
22
197
63
495
 53
53
488
20
384
 0.8
0.8
7
46
8
 0.7
0.7
6
25
7
 77
77
706
15
840
 26
26
242
10
246
 2
2
19
33
24
 2
2
16
12
20
 87
87
800
80
706
 1
1
9
12
3
 1.1
1.1
10
6
10
 1
1
9
9
9
 1.2
1.2
11
12
15
 0.9
0.9
8
97
10
 2
2
21
6
25
 3
3
28
37
17
 34
34
312
79
314
 2
2
15
8
13
 0.9
0.9
8
10
5
 2
2
21
2
10
 7
7
66
6
51
 2
2
20
8
25
 66
66
601
38
629
 1.2
1.2
11
15
13
 5
5
45
6
70
 2
2
14
6
16
 16
16
145
14
58
 42
42
389
30
202
 54
54
492
26
612
 13
13
123
59
300
 81
81
741
52
647
 100
100
916
35
1353
Evolution
Species Conservation
PhosphoNET % Identity:
PhosphoNET % Similarity:
Homologene %
Identity:
PhosphoNET % Identity:
PhosphoNET % Similarity:
Homologene %
Identity:
 100
100
100
100 84.2
84.2
84.6
98 79.4
79.4
81.5
92 -
-
-
73 -
-
-
- 73.9
73.9
82.3
75 -
-
-
- 20.6
20.6
32.2
61 57.9
57.9
70.9
59 -
-
-
- -
-
-
- 38
38
54.6
50.5 -
-
-
- 27.4
27.4
45.3
- -
-
-
- -
-
-
- -
-
-
- -
-
-
- 22.5
22.5
35.4
- -
-
-
- -
-
-
- -
-
-
- -
-
-
- -
-
-
- -
-
-
-
For a wider analysis go to PhosphoNET Evolution in PhosphoNET
Regulation
Activation:
NA
Inhibition:
NA
Synthesis:
NA
Degradation:
NA
Protein Kinase Specificity
Matrix of observed frequency (%) of amino acids in aligned protein substrate phosphosites
Matrix Type:
Predicted from the application of the Kinexus Kinase Substrate Predictor Version 2.0 algorithm, which was trained with over 10,000 kinase-protein substrate pairs and 8,000 kinase-peptide substrate pairs.
Domain #:
1
Inhibitors
For further details on these inhibitors click on the Compound Name and enter it into DrugKiNET or click on the ID's
Based on in vitro and/or in vivo phosphorylation data
| Compound Name | KD, Ki or IC50 (nM) | PubChem ID | ChEMBL ID | PubMed ID |
|---|
Disease Linkage
Gene Expression in Cancers:
TranscriptoNET (www.transcriptonet.ca) analysis with mRNA expression data retrieved from the National Center for Biotechnology Information's Gene Expression Omnibus (GEO) database, which was normalized against 60 abundantly and commonly found proteins, indicated altered expression for this protein kinase as shown here as the percent change from normal tissue controls (%CFC) as supported with the Student T-test in human Bladder carcinomas (%CFC= -59, p<0.0002).
Mutagenesis Experiments:
Insertional mutagenesis studies in mice have not yet revealed a role for this protein kinase in mouse cancer oncogenesis.
Mutation Rate in All Cancers:
Percent mutation rates per 100 amino acids length in human cancers: 0.08 % in 24458 diverse cancer specimens. This rate is very similar (+ 10% higher) to the average rate of 0.075 % calculated for human protein kinases in general.
Mutation Rate in Specific Cancers:
Highest percent mutation rates per 100 amino acids length in human cancers: 0.24 % in 864 skin cancers tested; 0.18 % in 1270 large intestine cancers tested; 0.17 % in 603 endometrium cancers tested; 0.12 % in 127 biliary tract cancers tested; 0.11 % in 629 stomach cancers tested; 0.09 % in 1636 lung cancers tested; 0.08 % in 273 cervix cancers tested; 0.06 % in 710 oesophagus cancers tested; 0.04 % in 833 ovary cancers tested; 0.03 % in 548 urinary tract cancers tested; 0.03 % in 2082 central nervous system cancers tested; 0.03 % in 1276 kidney cancers tested; 0.02 % in 942 upper aerodigestive tract cancers tested; 0.02 % in 382 soft tissue cancers tested; 0.02 % in 1459 pancreas cancers tested; 0.02 % in 1372 breast cancers tested; 0.01 % in 881 prostate cancers tested; 0.01 % in 558 thyroid cancers tested; 0.01 % in 2009 haematopoietic and lymphoid cancers tested.
Frequency of Mutated Sites:
Most frequent mutations with the number of reports indicated in brackets: M148T (4).
Comments:
Only 5 deletions, 2 insertions and no complex mutations are noted on the COSMIC website.