
Nomenclature
Short Name:
p38g
Full Name:
Mitogen-activated protein kinase 12
Alias:
- EC 2.7.11.24
- ERK5
- PRKM12
- SAPK3
- Stress-activated protein kinase-3
- ERK6
- MAPK12
- MK12
- p38 MAPK-gamma
Classification
Type:
Protein-serine/threonine kinase
Group:
CMGC
Family:
MAPK
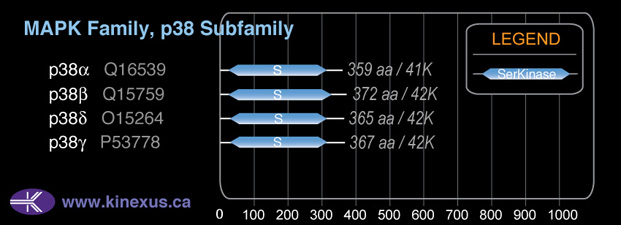
SubFamily:
p38

Specific Links
Structure
Mol. Mass (Da):
41,940
# Amino Acids:
367
# mRNA Isoforms:
2
mRNA Isoforms:
41,940 Da (367 AA; P53778); 40,808 Da (357 AA; P53778-2)
4D Structure:
Monomer. Interacts with the PDZ domain of the syntrophin SNTA1. Interacts with SH3BP5
1D Structure:
3D Image (rendered using PV Viewer):
PDB ID
Subfamily Alignment
Domain Distribution:
| Start | End | Domain |
|---|---|---|
| 27 | 311 | Pkinase |
Kinexus Products
Click on entries below for direct links to relevant products from Kinexus for this protein kinase.
hiddentext
Post-translation Modifications
For detailed information on phosphorylation of this kinase go to PhosphoNET
Serine phosphorylated:
S2, S3, S180.
Threonine phosphorylated:
T183+, T188-.
Tyrosine phosphorylated:
Y185+.
Ubiquitinated:
K346.
Distribution
Based on gene microarray analysis from the NCBI
Human Tissue Distribution
% Max Expression:
Mean Expression:
Number of Samples:
Standard Deviation:
% Max Expression:
Mean Expression:
Number of Samples:
Standard Deviation:
 57
57
1161
28
1110
 2
2
39
10
41
 2
2
41
12
31
 10
10
210
101
407
 31
31
631
28
387
 7
7
147
62
403
 5
5
96
39
250
 44
44
892
29
2234
 13
13
271
10
255
 2
2
51
53
31
 2
2
34
23
41
 28
28
566
116
639
 1
1
20
23
10
 2
2
33
6
22
 1.2
1.2
24
20
28
 1.1
1.1
23
17
28
 0.5
0.5
10
115
19
 3
3
57
17
38
 20
20
401
67
287
 15
15
313
102
243
 2
2
32
19
31
 1.4
1.4
28
21
30
 4
4
72
21
67
 2
2
36
17
33
 2
2
45
19
54
 45
45
917
69
1553
 2
2
40
26
27
 1.4
1.4
28
17
24
 2
2
46
17
28
 2
2
46
14
18
 15
15
304
18
216
 100
100
2050
31
4164
 19
19
396
72
809
 36
36
740
83
685
 9
9
175
48
273
Evolution
Species Conservation
PhosphoNET % Identity:
PhosphoNET % Similarity:
Homologene %
Identity:
PhosphoNET % Identity:
PhosphoNET % Similarity:
Homologene %
Identity:
 100
100
100
100 61.9
61.9
77.7
93 99.2
99.2
99.2
99 -
-
-
93 -
-
-
94 74.1
74.1
75.8
94 -
-
-
- 92.6
92.6
95.9
93 93.7
93.7
96.2
94 -
-
-
- 66.6
66.6
77.5
- 65.4
65.4
76.6
79 60.2
60.2
76.6
77 67.8
67.8
81.7
69 -
-
-
- 57
57
73.8
- -
-
-
- 54.6
54.6
72.2
- -
-
-
- -
-
-
- -
-
-
- -
-
-
- -
-
-
41 -
-
-
- -
-
-
-
For a wider analysis go to PhosphoNET Evolution in PhosphoNET
Binding Proteins
Examples of known interacting proteins
hiddentext
| No. | Name – UniProt ID |
|---|---|
| 1 | DUSP1 - P28562 |
| 2 | SNTA1 - Q13424 |
| 3 | SH3BP5 - O60239 |
| 4 | GRB2 - P62993 |
| 5 | MAP2K4 - P45985 |
| 6 | MAP2K6 - P52564 |
| 7 | MAP2K3 - P46734 |
| 8 | PKN1 - Q16512 |
| 9 | MAPT - P10636 |
| 10 | MAPKAPK5 - Q8IW41 |
| 11 | EEF2K - O00418 |
| 12 | DLG2 - Q15700 |
| 13 | DLG4 - P78352 |
| 14 | INADL - Q8NI35 |
| 15 | RGS3 - P49796 |
Regulation
Activation:
Phosphorylation at Tyr-185 and probably Thr-183 increases phosphotransferase activity.
Inhibition:
NA
Synthesis:
NA
Degradation:
NA
Known Upstream Kinases
For further details on these substrates click on the Substrate Short Name or UniProt ID. Phosphosite Location is hyperlinked to PhosphoNET
predictions.
Based on in vitro and/or in vivo phosphorylation data
| Kinase Short Name | UniProt ID (Human) | Phosphosite Location | Phosphosite Sequence | Effect of Phosphorylation |
|---|
Known Downstream Substrates
For further details on these substrates click on the Substrate Short Name or UniProt ID. Phosphosite Location is hyperlinked to PhosphoNET
predictions.
Based on in vitro and/or in vivo phosphorylation data
| Substrate Short Name | UniProt ID (Human) | Phosphosite Location | Phosphosite Sequence | Effect of Phosphorylation |
|---|
| Cyclin D3 (CCND3) | P30281 | T283 | QGPSQTSTPTDVTAI | |
| DLG1 (SAP97) | Q12959 | S122 | TPPQEHISPQITNEV | |
| DLG1 (SAP97) | Q12959 | S158 | FVSHSHISPIKPTEA | |
| DLG1 (SAP97) | Q12959 | T209 | VNTDSLETPTYVNGT | |
| DLG4 (PSD-95) | P78352 | S290 | PTAMTPTSPRRYSPV | |
| DLG4 (PSD-95) | P78352 | T287 | TDYPTAMTPTSPRRY | |
| SAKS1 | Q04323 | S200 | EPGPVPSSPSQEPPT | |
| SH3BP5 | O60239 | S351 | PGSLDLPSPVSLSEF | |
| SNTA1 | Q13424 | S193 | GWDSPPASPLQRQPS | |
| SNTA1 | Q13424 | S201 | PLQRQPSSPGPTPRN | |
| Tau iso8 | P10636-8 | S396 | GAEIVYKSPVVSGDT | |
| Tau iso8 | P10636-8 | S404 | PVVSGDTSPRHLSNV |
Protein Kinase Specificity
Matrix of observed frequency (%) of amino acids in aligned protein substrate phosphosites
Matrix Type:
Predicted from the application of the Kinexus Kinase Substrate Predictor Version 2.0 algorithm, which was trained with over 10,000 kinase-protein substrate pairs and 8,000 kinase-peptide substrate pairs. Note that additional binding sites on p38 substrates with D motifs (consensus= K/R-k-x-s-l/p-l-l-l-p-p or p-x-L/v/i-x-p-p-x-x-x-x-l-l-x-r/k-k/r-R/k-K/r) facilitate higher selectivity for phosphorylation by this protein kinase.
Domain #:
1
Inhibitors
For further details on these inhibitors click on the Compound Name and enter it into DrugKiNET or click on the ID's
Based on in vitro and/or in vivo phosphorylation data
| Compound Name | KD, Ki or IC50 (nM) | PubChem ID | ChEMBL ID | PubMed ID |
|---|
Disease Linkage
General Disease Association:
Cancer
Specific Cancer Types:
Breast cancer
Comments:
p38g overexpression is linked with highly metastatic breast cancer cell lines, and its expression is associated with the metastatic states of breast tumour samples. The gene was found to be deregulated in uterine leiomyoma.
Gene Expression in Cancers:
TranscriptoNET (www.transcriptonet.ca) analysis with mRNA expression data retrieved from the National Center for Biotechnology Information's Gene Expression Omnibus (GEO) database, which was normalized against 60 abundantly and commonly found proteins, indicated altered expression for this protein kinase as shown here as the percent change from normal tissue controls (%CFC) as supported with the Student T-test in the following types of human cancers: Brain oligodendrogliomas (%CFC= -100, p<0.057); Cervical cancer stage 2B (%CFC= -73, p<0.003); Oral squamous cell carcinomas (OSCC) (%CFC= +459, p<0.0001); Ovary adenocarcinomas (%CFC= +111, p<0.001); Pituitary adenomas (ACTH-secreting) (%CFC= +66); and Skin melanomas - malignant (%CFC= +88, p<0.0002). The COSMIC website notes an up-regulated expression score for p38g in diverse human cancers of 410, which is 0.9-fold of the average score of 462 for the human protein kinases. The down-regulated expression score of 15 for this protein kinase in human cancers was 0.3-fold of the average score of 60 for the human protein kinases.
Mutagenesis Experiments:
Insertional mutagenesis studies in mice have not yet revealed a role for this protein kinase in mouse cancer oncogenesis.
Mutation Rate in All Cancers:
Percent mutation rates per 100 amino acids length in human cancers: 0.04 % in 25371 diverse cancer specimens. This rate is -40 % lower than the average rate of 0.075 % calculated for human protein kinases in general.
Mutation Rate in Specific Cancers:
Highest percent mutation rates per 100 amino acids length in human cancers: 0.32 % in 1093 large intestine cancers tested.
Frequency of Mutated Sites:
None > 3 in 20,654 cancer specimens
Comments:
Only 2 deletions, and no insertions or complex mutations are noted on the COSMIC website. About 39% of the point mutations are silent and do not change the amino acid sequence of the protein kinase.