
Nomenclature
Short Name:
ALK1
Full Name:
Serine-threonine-protein kinase receptor R3
Alias:
- Activin A receptor type II-like 1
- EC 2.7.11.30
- HHT
- HHT2
- TSR-I
- Kinase ALK1; ORW2; SKR3; TGF-B superfamily receptor type I
- Activin receptor-like kinase 1
- ACVL1
- ACVRLK1
- ACVRL1
Classification
Type:
Protein-serine/threonine kinase
Group:
TKL
Family:
STKR
SubFamily:
Type1

Specific Links
Structure
Mol. Mass (Da):
56,124
# Amino Acids:
503
# mRNA Isoforms:
1
mRNA Isoforms:
56,124 Da (503 AA; P37023)
4D Structure:
NA
1D Structure:
3D Image (rendered using PV Viewer):
PDB ID
Subfamily Alignment
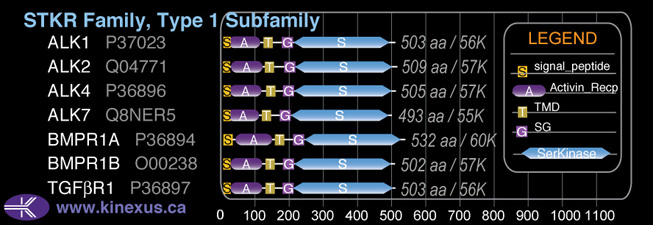
Domain Distribution:
| Start | End | Domain |
|---|---|---|
| 1 | 22 | signal_peptide |
| 19 | 103 | Activin_recp |
| 119 | 141 | TMD |
| 172 | 202 | GS |
| 202 | 494 | Pkinase |
Kinexus Products
Click on entries below for direct links to relevant products from Kinexus for this protein kinase.
hiddentext
Post-translation Modifications
For detailed information on phosphorylation of this kinase go to PhosphoNET
Acetylated:
K439, K440.
N-GlcNAcylated:
N98.
Serine phosphorylated:
S155, S160.
Tyrosine phosphorylated:
Y375-, Y421.
Distribution
Based on gene microarray analysis from the NCBI
Human Tissue Distribution
% Max Expression:
Mean Expression:
Number of Samples:
Standard Deviation:
% Max Expression:
Mean Expression:
Number of Samples:
Standard Deviation:
 51
51
1058
22
1022
 6
6
120
14
197
 7
7
146
10
137
 10
10
207
91
500
 30
30
614
21
487
 100
100
2072
54
5253
 29
29
592
37
723
 25
25
509
42
798
 12
12
258
10
170
 18
18
367
109
800
 11
11
231
35
529
 26
26
540
170
577
 7
7
138
21
153
 5
5
98
13
142
 9
9
196
32
375
 3
3
70
15
144
 5
5
112
422
833
 10
10
207
21
337
 4
4
73
82
79
 24
24
502
84
480
 6
6
117
29
138
 10
10
205
33
225
 7
7
151
19
220
 5
5
111
18
144
 5
5
104
31
112
 50
50
1034
58
1714
 4
4
82
24
101
 7
7
147
21
196
 9
9
187
21
220
 2
2
49
28
30
 22
22
455
18
326
 27
27
566
26
677
 0.05
0.05
1
56
1
 44
44
914
57
780
 3
3
70
35
55
Evolution
Species Conservation
PhosphoNET % Identity:
PhosphoNET % Similarity:
Homologene %
Identity:
PhosphoNET % Identity:
PhosphoNET % Similarity:
Homologene %
Identity:
 100
100
100
100 92.5
92.5
93.2
100 98.6
98.6
99.2
99 -
-
-
92 -
-
-
99 93.1
93.1
95.6
93 -
-
-
- 88.5
88.5
93
89 89.5
89.5
93.3
90 -
-
-
- 58.8
58.8
71.9
- 61.3
61.3
74
71 30.5
30.5
46.4
64 59.3
59.3
71
64 -
-
-
- 47.4
47.4
61.9
- -
-
-
- 31.4
31.4
47.2
- 49.6
49.6
64.8
- -
-
-
- -
-
-
- -
-
-
- -
-
-
- -
-
-
- -
-
-
-
For a wider analysis go to PhosphoNET Evolution in PhosphoNET
Binding Proteins
Examples of known interacting proteins
hiddentext
| No. | Name – UniProt ID |
|---|---|
| 1 | ACVR2A - P27037 |
| 2 | TGFBR2 - P37173 |
| 3 | TGFB1 - P01137 |
| 4 | ENG - P17813 |
| 5 | TGFBR1 - P36897 |
| 6 | XIAP - P98170 |
| 7 | TGFB3 - P10600 |
| 8 | TGFBRAP1 - Q8WUH2 |
| 9 | SNX6 - Q9UNH7 |
| 10 | SMAD4 - Q13485 |
Regulation
Activation:
Activated by binding activin, which induces heterodimerization and autophosphorylation.
Inhibition:
NA
Synthesis:
NA
Degradation:
NA
Protein Kinase Specificity
Matrix of observed frequency (%) of amino acids in aligned protein substrate phosphosites
Matrix Type:
Predicted from the application of the Kinexus Kinase Substrate Predictor Version 2.0 algorithm, which was trained with over 10,000 kinase-protein substrate pairs and 8,000 kinase-peptide substrate pairs.
Domain #:
1
Inhibitors
For further details on these inhibitors click on the Compound Name and enter it into DrugKiNET or click on the ID's
Based on in vitro and/or in vivo phosphorylation data
| Compound Name | KD, Ki or IC50 (nM) | PubChem ID | ChEMBL ID | PubMed ID |
|---|
Disease Linkage
General Disease Association:
Cancer, blood vessel disorders
Specific Diseases (Non-cancerous):
Hereditary hemorrhagic telangiectasia Type 2 (HHT2); Arteriovenous malformation; Primary pulmonary hypertension; Mixed connective tissue disease; Connective tissue disease; Hereditary hemorrhagic Telangiectasia Type 2; Klippel-Trenaunay syndrome; Angiodysplasia; Weber syndrome; Telangiectasis; Lymphomatoid papulosis; Pulmonary arteriovenous malformation; Heritable pulmonary arterial hypertension
Comments:
Loss of function mutations of the ALK1 gene at various sites are associated with hemorrhagic telangiectasia type 2, also known as Rendu-Osler-Weber syndrome 2. Many of these mutations result in retention of the receptor in the endoplasmic reticulum and loss of cell surface expression. The typical symptoms for this disease are recurrent epistaxis and gastro-intestinal hemorrhage. Arteriovenous malformations of the lung, liver and brain may also result.
Specific Cancer Types:
Anaplastic large cell lymphomas (ALCL); inflammatory myofibroblastic tumours
Comments:
ALK1 may be an oncoprotein (OP). As a receptor for TGF-beta, certain mutations in ALK1, in theory, may favour cell-growth via increased activation (or possibly constitutive activity) -- a gain of function, though the opposite -- loss of function -- is also possible. Mutations in this gene can cause hereditary hemorrhagic telangiectasia type 2 (HHT2) and Osler-Rendu-Weber syndrome 2 (ORW2). ALK1 has been targeted for development of pharmacological inhibitors to suppress angiogenesis during tumour growth.
Gene Expression in Cancers:
TranscriptoNET (www.transcriptonet.ca) analysis with mRNA expression data retrieved from the National Center for Biotechnology Information's Gene Expression Omnibus (GEO) database, which was normalized against 60 abundantly and commonly found proteins, indicated altered expression for this protein kinase as shown here as the percent change from normal tissue controls (%CFC) as supported with the Student T-test in the following types of human cancers: Classical Hodgkin lymphomas (%CFC= +82, p<0.001); Clear cell renal cell carcinomas (cRCC) (%CFC= +72, p<0.063); Clear cell renal cell carcinomas (cRCC) stage I (%CFC= +455, p<0.038); Colon mucosal cell adenomas (%CFC= -45, p<0.0001); Large B-cell lymphomas (%CFC= +60, p<0.0009); Lung adenocarcinomas (%CFC= -60, p<0.0001); and Ovary adenocarcinomas (%CFC= +374, p<0.007). The COSMIC website notes an up-regulated expression score for ALK1 in diverse human cancers of 302, which is 0.7-fold of the average score of 462 for the human protein kinases. The down-regulated expression score of 3 for this protein kinase in human cancers was 0.1-fold of the average score of 60 for the human protein kinases.
Mutagenesis Experiments:
Insertional mutagenesis studies in mice have not yet revealed a role for this protein kinase in mouse cancer oncogenesis.
Mutation Rate in All Cancers:
Percent mutation rates per 100 amino acids length in human cancers: 0.1 % in 24914 diverse cancer specimens. This rate is only 36 % higher than the average rate of 0.075 % calculated for human protein kinases in general.
Frequency of Mutated Sites:
None > 5 in 20,198 cancer specimens
Comments:
Only 6 deletions, no insertions or complex mutations are noted on the COSMIC website.