
Nomenclature
Short Name:
ALK4
Full Name:
Serine-threonine-protein kinase receptor R2
Alias:
- Activin A receptor, type IB
- ACVR1B
- ACVRLK4
- EC 2.7.1.37
- EC 2.7.11.30
- SKR2; KIR2; Serine/threonine-protein kinase receptor R2;
- Activin receptor-like kinase 4
- ActRIB
- ACTR-IB
- ACV1B
Classification
Type:
Protein-serine/threonine kinase
Group:
TKL
Family:
STKR
SubFamily:
Type1

Structure
Mol. Mass (Da):
56,807
# Amino Acids:
505
# mRNA Isoforms:
5
mRNA Isoforms:
61,439 Da (546 AA; P36896-4); 56,807 Da (505 AA; P36896); 54,270 Da (487 AA; P36896-3); 53,411 Da (476 AA; P36896-2); 51,725 Da (453 AA; P36896-5)
4D Structure:
Interacts with AIP1. Part of a complex consisting of AIP1, ACVR2A, ACVR1B and SMAD3. Interacts with TTRAP
1D Structure:
Subfamily Alignment
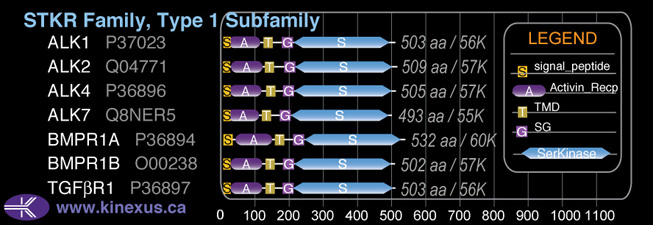
Domain Distribution:
| Start | End | Domain |
|---|---|---|
| 1 | 25 | signal_peptide |
| 18 | 109 | Activin_recp |
| 127 | 149 | TMD |
| 177 | 206 | GS |
| 207 | 499 | Pkinase |
Post-translation Modifications
For detailed information on phosphorylation of this kinase go to PhosphoNET
N-GlcNAcylated:
N43.
Serine phosphorylated:
S168.
Tyrosine phosphorylated:
Y156, Y184, Y380-, Y463.
Ubiquitinated:
K177.
Distribution
Based on gene microarray analysis from the NCBI
Human Tissue Distribution
% Max Expression:
Mean Expression:
Number of Samples:
Standard Deviation:
% Max Expression:
Mean Expression:
Number of Samples:
Standard Deviation:
 100
100
1021
84
1357
 8
8
83
46
126
 8
8
78
27
65
 35
35
356
265
499
 56
56
575
69
519
 5
5
49
222
76
 38
38
383
102
568
 53
53
540
114
675
 53
53
537
48
474
 20
20
203
276
270
 13
13
130
89
185
 58
58
597
532
605
 6
6
59
93
61
 7
7
68
36
93
 14
14
142
72
207
 7
7
75
47
140
 16
16
159
602
1052
 14
14
144
54
188
 8
8
79
267
111
 52
52
534
324
614
 10
10
97
66
132
 11
11
111
78
311
 11
11
116
41
111
 10
10
98
54
124
 10
10
105
67
166
 55
55
564
159
760
 5
5
55
99
60
 11
11
112
55
131
 8
8
86
53
112
 12
12
119
84
100
 45
45
462
72
500
 75
75
762
96
1540
 3
3
33
158
120
 81
81
832
161
728
 13
13
137
114
242
Evolution
Species Conservation
PhosphoNET % Identity:
PhosphoNET % Similarity:
Homologene %
Identity:
PhosphoNET % Identity:
PhosphoNET % Similarity:
Homologene %
Identity:
 100
100
100
100 92.9
92.9
93.1
100 99.6
99.6
99.8
100 -
-
-
99 -
-
-
- 94.1
94.1
94.7
99 -
-
-
- 98.2
98.2
99.4
98 98.8
98.8
99.6
99 -
-
-
- 67.5
67.5
78.6
- 50.3
50.3
65.3
90 31.1
31.1
48
86 78.2
78.2
87.1
83 -
-
-
- -
-
-
- -
-
-
- 27.8
27.8
42.1
- -
-
-
- -
-
-
- -
-
-
- -
-
-
- -
-
-
- -
-
-
- -
-
-
-
For a wider analysis go to PhosphoNET Evolution in PhosphoNET
Binding Proteins
Examples of known interacting proteins
hiddentext
| No. | Name – UniProt ID |
|---|---|
| 1 | INHBA - P08476 |
| 2 | ACVR2B - Q13705 |
| 3 | ACVR2A - P27037 |
| 4 | INHBB - P09529 |
| 5 | TDGF3 - P51864 |
| 6 | SMAD7 - O15105 |
| 7 | TDGF1 - P13385 |
| 8 | ACVR1 - Q04771 |
| 9 | INHBC - P55103 |
| 10 | SMAD4 - Q13485 |
| 11 | TGFBRAP1 - Q8WUH2 |
| 12 | BMPR2 - Q13873 |
| 13 | SMAD3 - P84022 |
| 14 | SMAD2 - Q15796 |
| 15 | IGSF1 - Q8N6C5 |
Regulation
Activation:
Activated by binding activin, which induces heterodimerization and autophosphorylation.
Inhibition:
NA
Synthesis:
NA
Degradation:
NA
Protein Kinase Specificity
Matrix of observed frequency (%) of amino acids in aligned protein substrate phosphosites
Matrix Type:
Predicted from the application of the Kinexus Kinase Substrate Predictor Version 2.0 algorithm, which was trained with over 10,000 kinase-protein substrate pairs and 8,000 kinase-peptide substrate pairs.
Domain #:
1
Inhibitors
For further details on these inhibitors click on the Compound Name and enter it into DrugKiNET or click on the ID's
Based on in vitro and/or in vivo phosphorylation data
| Compound Name | KD, Ki or IC50 (nM) | PubChem ID | ChEMBL ID | PubMed ID |
|---|
| PP121 | IC50 < 50 nM | 24905142 | 18849971 | |
| Lestaurtinib | Kd = 86 nM | 126565 | 22037378 | |
| AT9283 | IC50 > 100 nM | 24905142 | 19143567 | |
| SB431542 | Kd = 190 nM | 4521392 | 440084 | 18183025 |
| LY364947 | IC50 > 250 nM | 447966 | 261454 | 22037377 |
| SB505124 | IC50 > 250 nM | 16079009 | 1835714 | 22037377 |
| Dasatinib | Kd = 330 nM | 11153014 | 1421 | 18183025 |
| Staurosporine | Kd = 680 nM | 5279 | 18183025 | |
| Momelotinib | IC50 < 750 nM | 25062766 | 19295546 | |
| BMS-690514 | Kd > 800 nM | 11349170 | 21531814 | |
| SB202190 | Kd = 950 nM | 5353940 | 278041 | 18183025 |
| Silmitasertib | IC50 > 1 µM | 24748573 | 21174434 | |
| SNS314 | IC50 > 1 µM | 16047143 | 514582 | 18678489 |
| GDC0879 | IC50 = 2.5 µM | 11717001 | 525191 | 22037378 |
| SB203580 | Kd = 3 µM | 176155 | 10 | 18183025 |
| JNJ-28871063 | IC50 > 4 µM | 17747413 | 17975007 |
Disease Linkage
General Disease Association:
Cancer, systemic sclerosis
Specific Diseases (Non-cancerous):
Systemic scleroderma
Comments:
ALK4 is highly expressed in fibroblast cells leading to collagen production, and then to sclerosis.
Specific Cancer Types:
Pituitary tumours; Pancreatic carcinomas, somatic
Comments:
Heterozygosity of the ALK4 receptor gene is needed for proper function. Loss of heterozygosity was present in 34% (of 85 specimens) of pancreatic cancers, and in 45% (of 11 specimens) of pancreatic cell lines. Increased binding of ALK4 to actin occurred with the L40A, and V73A mutations, while decreased binding occurred with I70A, L75A, and P77A. Constitutive activation occurred with T206V.
Gene Expression in Cancers:
TranscriptoNET (www.transcriptonet.ca) analysis with mRNA expression data retrieved from the National Center for Biotechnology Information's Gene Expression Omnibus (GEO) database, which was normalized against 60 abundantly and commonly found proteins, indicated altered expression for this protein kinase as shown here as the percent change from normal tissue controls (%CFC) as supported with the Student T-test in human Skin melanomas - malignant (%CFC= -55, p<0.083). The COSMIC website notes an up-regulated expression score for ALK4 in diverse human cancers of 496, which is 1.1-fold of the average score of 462 for the human protein kinases. The down-regulated expression score of 49 for this protein kinase in human cancers was 0.8-fold of the average score of 60 for the human protein kinases.
Mutagenesis Experiments:
Insertional mutagenesis studies in mice support a role for this protein kinase in mouse cancer oncogenesis. Increased binding of ALK4 to actin can occur with L40A, and V73A mutations, while decreased binding can happen with I70A, L75A, and P77A. Constitutive activation can also be observed with T206V.
Mutation Rate in All Cancers:
Percent mutation rates per 100 amino acids length in human cancers: 0.1 % in 25526 diverse cancer specimens. This rate is only 33 % higher than the average rate of 0.075 % calculated for human protein kinases in general.
Frequency of Mutated Sites:
None > 4 in 20,778 cancer specimens
Comments:
Only 9 deletions, no insertions mutations or complex mutations are noted on the COSMIC website.