
Nomenclature
Short Name:
CK1e
Full Name:
Casein kinase I, epsilon isoform
Alias:
- Casein kinase 1, epsilon
- CKIe
- CKI-epsilon
- CSNK1E
- EC 2.7.11.1
- KC1E
Classification
Type:
Protein-serine/threonine kinase
Group:
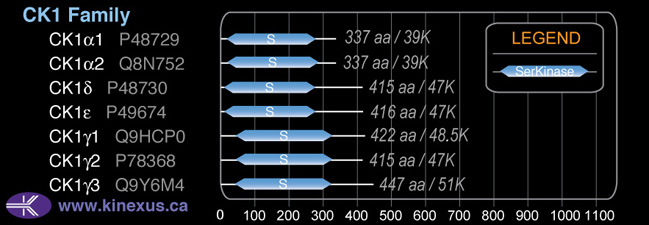
CK1
Family:
CK1
SubFamily:
NA

Specific Links
Structure
Mol. Mass (Da):
47,315
# Amino Acids:
416
# mRNA Isoforms:
1
mRNA Isoforms:
47,315 Da (416 AA; P49674)
4D Structure:
Monomer. Component of the circadian core oscillator, which includes the CRY proteins, CLOCK, or NPAS2, BMAL1 or BMAL2, CSNK1D and/or CSNK1E, TIMELESS and the PER proteins. Interacts directly with PER1 and PER2 which may lead to their degradation. Interacts with ANKRD6, DBNDD2, LRP5, LRP6 and SOCS3.
1D Structure:
3D Image (rendered using PV Viewer):
PDB ID
Subfamily Alignment
Domain Distribution:
| Start | End | Domain |
|---|---|---|
| 9 | 269 | Pkinase |
Post-translation Modifications
For detailed information on phosphorylation of this kinase go to PhosphoNET
Acetylated:
K242.
Serine phosphorylated:
S17, S323-, S343, S350, S354, S363, S368-, S377, S389-, S390, S391, S400, S405-, S408-.
Threonine phosphorylated:
T44+, T325-, T334-, T337-, T351, T362, T394, T407-.
Ubiquitinated:
K122, K130, K140, K263.
Distribution
Based on gene microarray analysis from the NCBI
Human Tissue Distribution
% Max Expression:
Mean Expression:
Number of Samples:
Standard Deviation:
% Max Expression:
Mean Expression:
Number of Samples:
Standard Deviation:
 68
68
1027
47
1012
 5
5
81
17
90
 38
38
574
11
564
 43
43
644
158
1339
 67
67
1006
45
655
 5
5
76
97
130
 10
10
153
51
407
 100
100
1507
59
3167
 36
36
543
17
457
 8
8
125
131
138
 7
7
101
40
126
 57
57
859
194
680
 13
13
192
33
363
 13
13
192
12
239
 19
19
292
34
339
 7
7
98
25
55
 17
17
258
452
390
 13
13
196
20
208
 9
9
131
129
167
 51
51
768
165
633
 27
27
401
32
506
 17
17
252
36
328
 25
25
383
21
331
 11
11
165
20
204
 14
14
214
32
226
 77
77
1158
100
1532
 11
11
165
36
317
 26
26
389
20
540
 34
34
514
20
675
 8
8
114
56
80
 48
48
716
36
593
 76
76
1146
46
1694
 24
24
361
92
793
 57
57
853
109
735
 23
23
350
70
400
Evolution
Species Conservation
PhosphoNET % Identity:
PhosphoNET % Similarity:
Homologene %
Identity:
PhosphoNET % Identity:
PhosphoNET % Similarity:
Homologene %
Identity:
 100
100
100
100 92.5
92.5
92.5
100 72.6
72.6
75
100 -
-
-
100 -
-
-
100 99.3
99.3
99.3
99 -
-
-
- 98.8
98.8
99
99 57
57
65.9
99 -
-
-
- -
-
-
- 97.4
97.4
98.6
97 84.4
84.4
88.5
97 84.4
84.4
88.7
84 -
-
-
- 62.7
62.7
73
85 67.5
67.5
77.4
- -
-
-
- 67.6
67.6
75.4
- -
-
-
- -
-
-
- -
-
-
74 56.7
56.7
70
78 46.1
46.1
63.8
- -
-
-
-
For a wider analysis go to PhosphoNET Evolution in PhosphoNET
Binding Proteins
Examples of known interacting proteins
hiddentext
| No. | Name – UniProt ID |
|---|---|
| 1 | PER2 - O15055 |
| 2 | APC - P25054 |
| 3 | DVL3 - Q92997 |
| 4 | ARNTL - O00327 |
| 5 | CRY1 - Q16526 |
| 6 | PRKD2 - Q9BZL6 |
| 7 | BID - P55957 |
| 8 | AXIN2 - Q9Y2T1 |
| 9 | PPP1R14A - Q96A00 |
| 10 | CCNA1 - P78396 |
| 11 | DVL2 - O14641 |
| 12 | POLR2A - P24928 |
| 13 | CSNK1G2 - P78368 |
| 14 | CSNK1G1 - Q9HCP0 |
| 15 | CSNK1D - P48730 |
Regulation
Activation:
NA
Inhibition:
Phosphorylation of Ser-323, Thr-325, Thr-334, Thr-337, Ser-368, Ser-405 and Thr-407 inhibits phosphotransferase activity.
Synthesis:
NA
Degradation:
Down-regulated during granulocytic differentiation.
Known Upstream Kinases
For further details on these substrates click on the Substrate Short Name or UniProt ID. Phosphosite Location is hyperlinked to PhosphoNET
predictions.
Based on in vitro and/or in vivo phosphorylation data
| Kinase Short Name | UniProt ID (Human) | Phosphosite Location | Phosphosite Sequence | Effect of Phosphorylation |
|---|
| CK1e | P49674 | S323 | RMGQLRGSATRALPP | - |
| CK1e | P49674 | T325 | GQLRGSATRALPPGP | - |
| CK1e | P49674 | T334 | ALPPGPPTGATANRL | - |
| CK1e | P49674 | T337 | PGPPTGATANRLRSA | - |
| CK1e | P49674 | S368 | NTSPRAISRVDRERK | - |
| AMPKa1 | Q13131 | S389 | RGAPANVSSSDLTGR | - |
| CK1e | P49674 | S405 | EVSRIPASQTSVPFD | - |
| CK1e | P49674 | T407 | SRIPASQTSVPFDHL | - |
| CK1e | P49674 | S408 | RIPASQTSVPFDHLG | - |
Known Downstream Substrates
For further details on these substrates click on the Substrate Short Name or UniProt ID. Phosphosite Location is hyperlinked to PhosphoNET
predictions.
Based on in vitro and/or in vivo phosphorylation data
| Substrate Short Name | UniProt ID (Human) | Phosphosite Location | Phosphosite Sequence | Effect of Phosphorylation |
|---|
| APC | P25054 | S1279 | SRCSSLSSLSSAEDE | |
| APC | P25054 | S1392 | SRCTSVSSLDSFESR | |
| CDH1 | P12830 | S844 | GSGSEAASLSSLNSS | - |
| CK1e1 (CSNK1E) | P49674 | S323 | RMGQLRGSATRALPP | - |
| CK1e1 (CSNK1E) | P49674 | S368 | NTSPRAISRVDRERK | - |
| CK1e1 (CSNK1E) | P49674 | S405 | EVSRIPASQTSVPFD | - |
| CK1e1 (CSNK1E) | P49674 | S408 | RIPASQTSVPFDHLG | - |
| CK1e1 (CSNK1E) | P49674 | T325 | GQLRGSATRALPPGP | - |
| CK1e1 (CSNK1E) | P49674 | T334 | ALPPGPPTGATANRL | - |
| CK1e1 (CSNK1E) | P49674 | T337 | PGPPTGATANRLRSA | - |
| CK1e1 (CSNK1E) | P49674 | T407 | SRIPASQTSVPFDHL | - |
| CTNNB1 | P35222 | S45 | GATTTAPSLSGKGNP | + |
| CTNNB1 | P35222 | T41 | GIHSGATTTAPSLSG | ? |
| DARPP-32 | Q9UD71 | S137 | EEEEEEDSQAEVLKV | |
| DVL1 | O14640 | S139 | DNETGTESMVSHRRE | |
| DVL1 | O14640 | S142 | TGTESMVSHRRERAR | |
| E4BP4 | Q16649 | S182 | CISVIKHSPQSSLSD | |
| LRP6 | O75581 | S1420 | YVVHGPASVPLGYVP | |
| LRP6 | O75581 | S1431 | GYVPHPSSLSGSLPG | |
| p53 | P04637 | S6 | __MEEPQSDPSVEPP | + |
| p53 | P04637 | S9 | EEPQSDPSVEPPLSQ | |
| Per1 | O15534 | S661 | SSSYTTSSASDDDRQ | |
| Per1 | O15534 | S663 | SYTTSSASDDDRQRT | |
| Per1 | O15534 | S714 | ALANKAESVVSVTSQ | |
| Per2 | O15055 | S662 | ALPGKAESVASLTSQ |
Protein Kinase Specificity
Matrix of observed frequency (%) of amino acids in aligned protein substrate phosphosites
Matrix Type:
Experimentally derived from alignment of 34 known protein substrate phosphosites.
Domain #:
1
Inhibitors
For further details on these inhibitors click on the Compound Name and enter it into DrugKiNET or click on the ID's
Based on in vitro and/or in vivo phosphorylation data
| Compound Name | KD, Ki or IC50 (nM) | PubChem ID | ChEMBL ID | PubMed ID |
|---|
Disease Linkage
General Disease Association:
Sleep disorders
Specific Diseases (Non-cancerous):
Advanced sleep phase syndrome
Comments:
Advanced Sleep Phase Syndrome is a rare genetic disorder causing the sleep cycle to shift forward so that sufferers fall asleep in the early evening, and wake up in the early morning.
Gene Expression in Cancers:
TranscriptoNET (www.transcriptonet.ca) analysis with mRNA expression data retrieved from the National Center for Biotechnology Information's Gene Expression Omnibus (GEO) database, which was normalized against 60 abundantly and commonly found proteins, indicated altered expression for this protein kinase as shown here as the percent change from normal tissue controls (%CFC) as supported with the Student T-test in the following types of human cancers: Breast epithelial cell carcinomas (%CFC= +87, p<0.039); Cervical cancer stage 2B (%CFC= -63); Clear cell renal cell carcinomas (cRCC) stage I (%CFC= +370, p<0.0001); Colon mucosal cell adenomas (%CFC= +61, p<0.0001); Colorectal adenocarcinomas (early onset) (%CFC= +53, p<0.002); Large B-cell lymphomas (%CFC= +87, p<(0.0003); and Ovary adenocarcinomas (%CFC= +82, p<0.005). The COSMIC website notes an up-regulated expression score for CK1e in diverse human cancers of 439, which is close to the average score of 462 for the human protein kinases. The down-regulated expression score of 85 for this protein kinase in human cancers was 1.4-fold of the average score of 60 for the human protein kinases.
Mutagenesis Experiments:
Insertional mutagenesis studies in mice have not yet revealed a role for this protein kinase in mouse cancer oncogenesis.
Mutation Rate in All Cancers:
Percent mutation rates per 100 amino acids length in human cancers: 0.07 % in 25161 diverse cancer specimens. This rate is only -1 % lower and is very similar to the average rate of 0.075 % calculated for human protein kinases in general.
Mutation Rate in Specific Cancers:
Highest percent mutation rates per 100 amino acids length in human cancers: 0.29 % in 589 stomach cancers tested; 0.28 % in 1270 large intestine cancers tested.
Frequency of Mutated Sites:
Most frequent mutations with the number of reports indicated in brackets: N172D (3). These mutations are located in the kinase catalytic domain.
Comments:
Only 2 deletion, 1 complex and no insertions mutations are noted on the COSMIC website.