
Nomenclature
Short Name:
CK1g2
Full Name:
Casein kinase I, gamma 2 isoform
Alias:
- CK1-gamma2
- CKI-gamma 2
- EC 2.7.11.1
- KC12
- KC1G2
- CSNK1G2
Classification
Type:
Protein-serine/threonine kinase
Group:
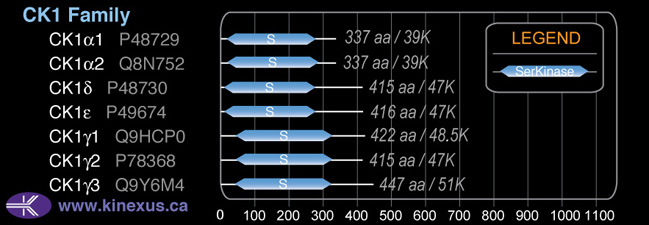
CK1
Family:
CK1
SubFamily:
NA

Specific Links
Structure
Mol. Mass (Da):
47,457
# Amino Acids:
415
# mRNA Isoforms:
1
mRNA Isoforms:
47,457 Da (415 AA; P78368)
4D Structure:
Monomer
1D Structure:
3D Image (rendered using PV Viewer):
PDB ID
Subfamily Alignment
Domain Distribution:
| Start | End | Domain |
|---|---|---|
| 46 | 308 | Pkinase |
Post-translation Modifications
For detailed information on phosphorylation of this kinase go to PhosphoNET
Methylated:
R25.
Serine phosphorylated:
S26, S33, S36, S359, S366, S381, S410.
Threonine phosphorylated:
T35, T68, T138, T141, T151, T158, T259, T336, T367, T377.
Tyrosine phosphorylated:
Y67, Y71, Y90, Y93, Y264.
Ubiquitinated:
K256.
Distribution
Based on gene microarray analysis from the NCBI
Human Tissue Distribution
% Max Expression:
Mean Expression:
Number of Samples:
Standard Deviation:
% Max Expression:
Mean Expression:
Number of Samples:
Standard Deviation:
 26
26
832
29
924
 4
4
142
19
66
 9
9
280
12
266
 15
15
484
111
606
 31
31
985
25
730
 14
14
462
82
1228
 16
16
501
39
635
 22
22
714
59
1057
 19
19
604
17
464
 6
6
185
105
185
 5
5
170
41
160
 19
19
616
212
640
 8
8
246
34
240
 2
2
72
18
64
 7
7
216
35
243
 5
5
164
17
95
 8
8
262
415
1511
 5
5
154
24
183
 4
4
139
99
113
 21
21
662
109
643
 10
10
320
35
384
 15
15
476
39
541
 7
7
218
22
180
 13
13
426
25
306
 13
13
409
35
525
 25
25
790
69
1157
 7
7
217
37
179
 7
7
236
24
247
 6
6
187
25
190
 4
4
135
28
84
 29
29
916
24
675
 52
52
1664
36
2658
 19
19
596
60
537
 29
29
940
57
864
 100
100
3213
35
2739
Evolution
Species Conservation
PhosphoNET % Identity:
PhosphoNET % Similarity:
Homologene %
Identity:
PhosphoNET % Identity:
PhosphoNET % Similarity:
Homologene %
Identity:
 100
100
100
100 80
80
87.2
94 83.4
83.4
90.4
99 -
-
-
96 -
-
-
- 95.2
95.2
97.6
95 -
-
-
- 95.2
95.2
97.1
95 94.9
94.9
97.1
95 -
-
-
- -
-
-
- 75.2
75.2
82.5
89 72.6
72.6
79.8
- 79.3
79.3
86.7
89 -
-
-
- 41.4
41.4
59.3
- -
-
-
- -
-
-
68 -
-
-
- -
-
-
- -
-
-
- -
-
-
- 44.2
44.2
62
- 36.6
36.6
50.2
57 -
-
-
64
For a wider analysis go to PhosphoNET Evolution in PhosphoNET
Binding Proteins
Examples of known interacting proteins
hiddentext
| No. | Name – UniProt ID |
|---|---|
| 1 | NCK1 - P16333 |
| 2 | SMAD3 - P84022 |
| 3 | PPP1R14A - Q96A00 |
| 4 | COL4A3BP - Q9Y5P4 |
| 5 | CSNK1G3 - Q9Y6M4 |
| 6 | CSNK1G1 - Q9HCP0 |
| 7 | CSNK1D - P48730 |
| 8 | CSNK1E - P49674 |
Regulation
Activation:
NA
Inhibition:
NA
Synthesis:
NA
Degradation:
NA
Known Downstream Substrates
For further details on these substrates click on the Substrate Short Name or UniProt ID. Phosphosite Location is hyperlinked to PhosphoNET
predictions.
Based on in vitro and/or in vivo phosphorylation data
| Substrate Short Name | UniProt ID (Human) | Phosphosite Location | Phosphosite Sequence | Effect of Phosphorylation |
|---|
Protein Kinase Specificity
Matrix of observed frequency (%) of amino acids in aligned protein substrate phosphosites
Matrix Type:
Predicted from the application of the Kinexus Kinase Substrate Predictor Version 2.0 algorithm, which was trained with over 10,000 kinase-protein substrate pairs and 8,000 kinase-peptide substrate pairs.
Domain #:
1
Inhibitors
For further details on these inhibitors click on the Compound Name and enter it into DrugKiNET or click on the ID's
Based on in vitro and/or in vivo phosphorylation data
| Compound Name | KD, Ki or IC50 (nM) | PubChem ID | ChEMBL ID | PubMed ID |
|---|
Disease Linkage
General Disease Association:
Neurological disorders
Specific Diseases (Non-cancerous):
Familial febrile seizures
Comments:
Single nucleotide polymorphisms (SNPs) in the CK1g2 gene have been linked to the occurence of febrile seizures in the Han Chinese population. Specifically, the SNPs re740423, rs2277737, and rs1059684 were observed to be associated with the occurence of febrile seizures, indicating a potential role for the gene in the pathology of the condition. Febrile seizures, as known as a fever fit, is a neurological event characterized by the concurrence of an epileptic seizure with elevated body temperature. These events are most common in children between the ages of 6 months and 5 years.
Gene Expression in Cancers:
TranscriptoNET (www.transcriptonet.ca) analysis with mRNA expression data retrieved from the National Center for Biotechnology Information's Gene Expression Omnibus (GEO) database, which was normalized against 60 abundantly and commonly found proteins, indicated altered expression for this protein kinase as shown here as the percent change from normal tissue controls (%CFC) as supported with the Student T-test in the following types of human cancers: Cervical cancer stage 2A (%CFC= +48, p<0.057); Cervical cancer stage 2B (%CFC= +82, p<0.095); and Prostate cancer - primary (%CFC= +78, p<0.0001). The COSMIC website notes an up-regulated expression score for CK1g2 in diverse human cancers of 440, which is close to the average score of 462 for the human protein kinases. The down-regulated expression score of 151 for this protein kinase in human cancers was 2.5-fold of the average score of 60 for the human protein kinases.
Mutagenesis Experiments:
Insertional mutagenesis studies in mice have not yet revealed a role for this protein kinase in mouse cancer oncogenesis.
Mutation Rate in All Cancers:
Percent mutation rates per 100 amino acids length in human cancers: 0.07 % in 24726 diverse cancer specimens. This rate is only -12 % lower than the average rate of 0.075 % calculated for human protein kinases in general.
Mutation Rate in Specific Cancers:
Highest percent mutation rates per 100 amino acids length in human cancers: 0.38 % in 1270 large intestine cancers tested; 0.2 % in 864 skin cancers tested; 0.16 % in 603 endometrium cancers tested.
Frequency of Mutated Sites:
None > 2 in 20,009 cancer specimens
Comments:
Only 1 deletion, and no insertions or complex mutations are noted on the COSMIC website.