
Nomenclature
Short Name:
CaMKK2
Full Name:
Calcium-calmodulin-dependent protein kinase kinase 2
Alias:
- Calcium/calmodulin-dependent protein kinase
- Calcium/calmodulin-dependent protein kinase kinase 2, beta
- EC 2.7.11.17
- KIAA0787
- KKCC2
- MGC15254
- CaM-kinase kinase beta
- CAMKK
- CaMKK beta
- CAMKKB
Classification
Type:
Protein-serine/threonine kinase
Group:
Other
Family:
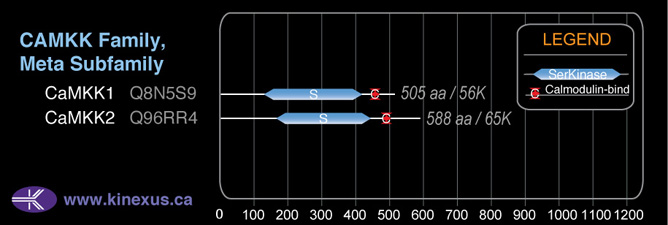
CAMKK
SubFamily:
Meta

Structure
Mol. Mass (Da):
64,732
# Amino Acids:
588
# mRNA Isoforms:
7
mRNA Isoforms:
64,746 Da (588 AA; Q96RR4); 61,386 Da (556 AA; Q96RR4-7); 59,971 Da (545 AA; Q96RR4-4); 59,602 Da (541 AA; Q96RR4-3); 58,899 Da (533 AA; Q96RR4-2); 54,827 Da (498 AA; Q96RR4-5); 54,124 Da (490 AA; Q96RR4-6)
4D Structure:
Interacts with calmodulin
1D Structure:
3D Image (rendered using PV Viewer):
PDB ID
Subfamily Alignment
Domain Distribution:
| Start | End | Domain |
|---|---|---|
| 165 | 446 | Pkinase |
Post-translation Modifications
For detailed information on phosphorylation of this kinase go to PhosphoNET
Serine phosphorylated:
S95, S100, S114, S125, S129, S132, S133, S136, S137, S495, S509, S511, .
Threonine phosphorylated:
T85, T145, T350, T522.
Tyrosine phosphorylated:
Y128, Y183, Y190, Y234.
Ubiquitinated:
K173, K241, K314, K403.
Distribution
Based on gene microarray analysis from the NCBI
Human Tissue Distribution
% Max Expression:
Mean Expression:
Number of Samples:
Standard Deviation:
% Max Expression:
Mean Expression:
Number of Samples:
Standard Deviation:
 76
76
1082
52
1193
 12
12
174
31
206
 11
11
155
19
196
 44
44
626
178
637
 48
48
681
50
639
 5
5
69
148
78
 13
13
181
61
387
 100
100
1432
75
4789
 37
37
534
37
495
 9
9
124
137
127
 12
12
172
57
246
 53
53
765
292
662
 7
7
106
63
128
 11
11
152
24
178
 10
10
147
46
185
 8
8
118
29
129
 20
20
286
227
233
 7
7
105
36
156
 6
6
80
166
78
 36
36
521
221
566
 10
10
142
41
154
 16
16
223
50
280
 9
9
135
23
197
 5
5
75
38
91
 11
11
160
40
185
 52
52
739
107
1303
 7
7
98
72
112
 9
9
133
37
179
 11
11
159
38
164
 12
12
170
56
114
 32
32
463
36
572
 98
98
1403
72
2471
 8
8
117
106
163
 61
61
872
104
716
 12
12
169
61
172
Evolution
Species Conservation
PhosphoNET % Identity:
PhosphoNET % Similarity:
Homologene %
Identity:
PhosphoNET % Identity:
PhosphoNET % Similarity:
Homologene %
Identity:
 100
100
100
100 0
0
0
0 98.4
98.4
98.8
99 -
-
-
92 -
-
-
- 92.1
92.1
93.8
94 -
-
-
- 91.8
91.8
94.2
92 92.5
92.5
94.9
92 -
-
-
- 38.6
38.6
50.5
- -
-
-
84 53.7
53.7
67.3
77 52.2
52.2
64.1
70 -
-
-
- -
-
-
54 -
-
-
- 21.5
21.5
40
56 44.7
44.7
58.4
- -
-
-
- -
-
-
- -
-
-
- -
-
-
40 -
-
-
- -
-
-
45
For a wider analysis go to PhosphoNET Evolution in PhosphoNET
Binding Proteins
Examples of known interacting proteins
hiddentext
| No. | Name – UniProt ID |
|---|---|
| 1 | CAMK1 - Q14012 |
| 2 | SGK1 - O00141 |
| 3 | PRKACA - P17612 |
| 4 | CAMK4 - Q16566 |
| 5 | CALM1 - P62158 |
| 6 | CEP63 - Q96MT8 |
Regulation
Activation:
Activated by Ca2+/calmodulin. ; Autophosphorylation does not alter activity or regulation by Ca2+/calmodulin. In part, activity is independent on Ca2+/calmodulin
Inhibition:
Binding of calmodulin may releave intrasteric autoinhibition. Partially inhibited upon phosphorylation by PRCAKA/PKA
Synthesis:
NA
Degradation:
NA
Known Downstream Substrates
For further details on these substrates click on the Substrate Short Name or UniProt ID. Phosphosite Location is hyperlinked to PhosphoNET
predictions.
Based on in vitro and/or in vivo phosphorylation data
| Substrate Short Name | UniProt ID (Human) | Phosphosite Location | Phosphosite Sequence | Effect of Phosphorylation |
|---|
Protein Kinase Specificity
Matrix of observed frequency (%) of amino acids in aligned protein substrate phosphosites
Matrix Type:
Predicted from the application of the Kinexus Kinase Substrate Predictor Version 2.0 algorithm, which was trained with over 10,000 kinase-protein substrate pairs and 8,000 kinase-peptide substrate pairs.
Domain #:
1
Inhibitors
For further details on these inhibitors click on the Compound Name and enter it into DrugKiNET or click on the ID's
Based on in vitro and/or in vivo phosphorylation data
| Compound Name | KD, Ki or IC50 (nM) | PubChem ID | ChEMBL ID | PubMed ID |
|---|
Disease Linkage
General Disease Association:
Cancer
Specific Cancer Types:
Malignant melanomas
Comments:
CAMKK2 appears to be an oncoprotein (OP). Malignant melanoma is linked to an SNP in CaMKK2 in the cytogenetic location 12q24. 31. Malignant melanoma is linked to an SNP in CaMKK2 in the cytogenetic location 12q24. 31. CaMKK2 is over-expressed in many prostate cancers, and becomes perinuclear/nuclear with advanced disease in human and mouse prostate cancer specimens. expression of CaMKK2 is up-regulated in hepatocellular carcinoma (HCC) and hepatic cancer cell lines and is negatively correlated with HCC patient survival. Loss of CaMKK2 function is sufficient to reduce liver cancer cell growth, and the growth defect resulting from loss of CaMKK2 can be rescued by ectopic expression of wild-type CaMKK2 but not by kinase-inactive mutants. Loss of CaMKK2 in CAMKK2-null mice, when compared to wild-type mice, protected them from high-fat diet (HFD)-induced obesity, from inflammation in adipose, from endotoxin shock, from fulminant hepatitis, and they remain glucose-tolerant.
Gene Expression in Cancers:
TranscriptoNET (www.transcriptonet.ca) analysis with mRNA expression data retrieved from the National Center for Biotechnology Information's Gene Expression Omnibus (GEO) database, which was normalized against 60 abundantly and commonly found proteins, indicated altered expression for this protein kinase as shown here as the percent change from normal tissue controls (%CFC) as supported with the Student T-test in the following types of human cancers: Large B-cell lymphomas (%CFC= +62, p<0.105); Prostate cancer (%CFC= +171, p<0.024); Prostate cancer - metastatic (%CFC= +89, p<0.0001); T-cell prolymphocytic leukemia (%CFC= +120, p<0.025). The COSMIC website notes an up-regulated expression score for CAMKK2 in diverse human cancers of 419, which is 0.9-fold of the average score of 462 for the human protein kinases. The down-regulated expression score of 138 for this protein kinase in human cancers was 2.3-fold of the average score of 60 for the human protein kinases.
Mutagenesis Experiments:
Insertional mutagenesis studies in mice have not yet revealed a role for this protein kinase in mouse cancer oncogenesis.
Mutation Rate in All Cancers:
Percent mutation rates per 100 amino acids length in human cancers: 0.07 % in 24842 diverse cancer specimens. This rate is only -1 % lower and is very similar to the average rate of 0.075 % calculated for human protein kinases in general.
Mutation Rate in Specific Cancers:
Highest percent mutation rates per 100 amino acids length in human cancers: 0.49 % in 805 skin cancers tested; 0.33 % in 1184 large intestine cancers tested.
Frequency of Mutated Sites:
None > 4 in 20,125 cancer specimens
Comments:
Only 4 deletions, 1 insertion and no complex mutations are noted on the COSMIC website.